Shoshone vs Tongan Female Disability
COMPARE
Shoshone
Tongan
Female Disability
Female Disability Comparison
Shoshone
Tongans
13.2%
FEMALE DISABILITY
0.0/ 100
METRIC RATING
291st/ 347
METRIC RANK
11.3%
FEMALE DISABILITY
100.0/ 100
METRIC RATING
49th/ 347
METRIC RANK
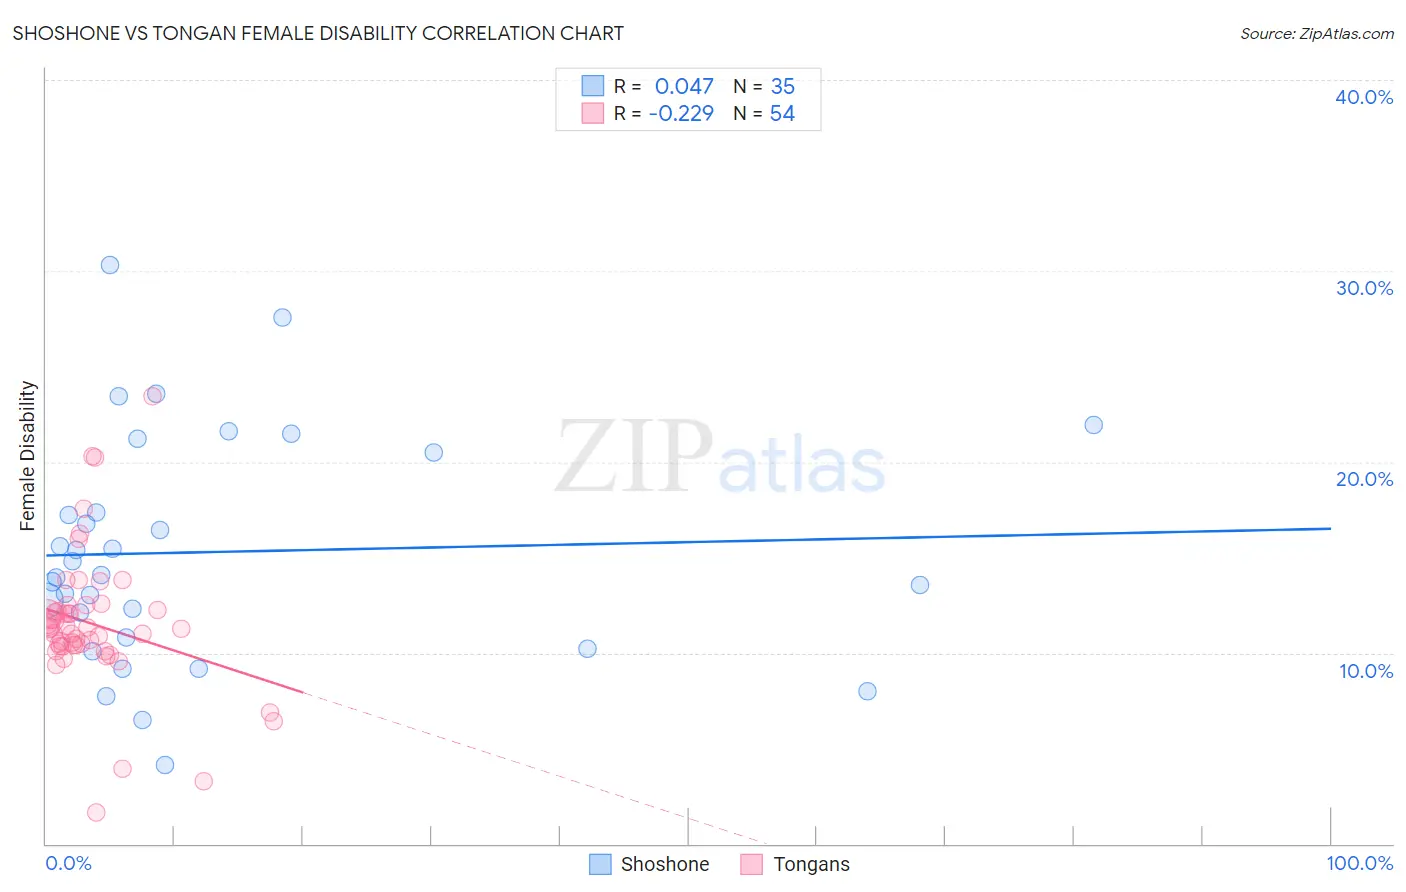
Shoshone vs Tongan Female Disability Correlation Chart
The statistical analysis conducted on geographies consisting of 66,617,208 people shows no correlation between the proportion of Shoshone and percentage of females with a disability in the United States with a correlation coefficient (R) of 0.047 and weighted average of 13.2%. Similarly, the statistical analysis conducted on geographies consisting of 102,892,967 people shows a weak negative correlation between the proportion of Tongans and percentage of females with a disability in the United States with a correlation coefficient (R) of -0.229 and weighted average of 11.3%, a difference of 17.2%.
Female Disability Correlation Summary
| Measurement | Shoshone | Tongan |
| Minimum | 4.1% | 1.6% |
| Maximum | 30.3% | 23.4% |
| Range | 26.2% | 21.8% |
| Mean | 15.3% | 11.5% |
| Median | 14.1% | 11.3% |
| Interquartile 25% (IQ1) | 10.8% | 10.3% |
| Interquartile 75% (IQ3) | 20.5% | 12.3% |
| Interquartile Range (IQR) | 9.7% | 1.9% |
| Standard Deviation (Sample) | 6.0% | 3.6% |
| Standard Deviation (Population) | 5.9% | 3.6% |
Similar Demographics by Female Disability
Demographics Similar to Shoshone by Female Disability
In terms of female disability, the demographic groups most similar to Shoshone are Tlingit-Haida (13.2%, a difference of 0.060%), Immigrants from Yemen (13.2%, a difference of 0.060%), Yakama (13.2%, a difference of 0.17%), White/Caucasian (13.2%, a difference of 0.24%), and Yaqui (13.2%, a difference of 0.34%).
| Demographics | Rating | Rank | Female Disability |
| Hmong | 0.0 /100 | #284 | Tragic 13.1% |
| Bangladeshis | 0.0 /100 | #285 | Tragic 13.1% |
| Fijians | 0.0 /100 | #286 | Tragic 13.1% |
| Yaqui | 0.0 /100 | #287 | Tragic 13.2% |
| Whites/Caucasians | 0.0 /100 | #288 | Tragic 13.2% |
| Tlingit-Haida | 0.0 /100 | #289 | Tragic 13.2% |
| Immigrants | Yemen | 0.0 /100 | #290 | Tragic 13.2% |
| Shoshone | 0.0 /100 | #291 | Tragic 13.2% |
| Yakama | 0.0 /100 | #292 | Tragic 13.2% |
| Marshallese | 0.0 /100 | #293 | Tragic 13.3% |
| Celtics | 0.0 /100 | #294 | Tragic 13.3% |
| French | 0.0 /100 | #295 | Tragic 13.3% |
| Nepalese | 0.0 /100 | #296 | Tragic 13.3% |
| Slovaks | 0.0 /100 | #297 | Tragic 13.3% |
| Immigrants | Nonimmigrants | 0.0 /100 | #298 | Tragic 13.4% |
Demographics Similar to Tongans by Female Disability
In terms of female disability, the demographic groups most similar to Tongans are Jordanian (11.3%, a difference of 0.010%), Zimbabwean (11.3%, a difference of 0.010%), Immigrants from Nepal (11.3%, a difference of 0.030%), Immigrants from Sweden (11.3%, a difference of 0.080%), and Cambodian (11.3%, a difference of 0.12%).
| Demographics | Rating | Rank | Female Disability |
| Israelis | 100.0 /100 | #42 | Exceptional 11.2% |
| Afghans | 100.0 /100 | #43 | Exceptional 11.2% |
| Cambodians | 100.0 /100 | #44 | Exceptional 11.3% |
| Immigrants | Sweden | 100.0 /100 | #45 | Exceptional 11.3% |
| Immigrants | Nepal | 100.0 /100 | #46 | Exceptional 11.3% |
| Jordanians | 100.0 /100 | #47 | Exceptional 11.3% |
| Zimbabweans | 100.0 /100 | #48 | Exceptional 11.3% |
| Tongans | 100.0 /100 | #49 | Exceptional 11.3% |
| Inupiat | 100.0 /100 | #50 | Exceptional 11.3% |
| Immigrants | Belgium | 100.0 /100 | #51 | Exceptional 11.3% |
| Immigrants | Peru | 99.9 /100 | #52 | Exceptional 11.3% |
| Immigrants | Saudi Arabia | 99.9 /100 | #53 | Exceptional 11.3% |
| Peruvians | 99.9 /100 | #54 | Exceptional 11.3% |
| Bulgarians | 99.9 /100 | #55 | Exceptional 11.3% |
| Taiwanese | 99.9 /100 | #56 | Exceptional 11.4% |