Shoshone vs Spanish American Female Disability
COMPARE
Shoshone
Spanish American
Female Disability
Female Disability Comparison
Shoshone
Spanish Americans
13.2%
FEMALE DISABILITY
0.0/ 100
METRIC RATING
291st/ 347
METRIC RANK
14.0%
FEMALE DISABILITY
0.0/ 100
METRIC RATING
316th/ 347
METRIC RANK
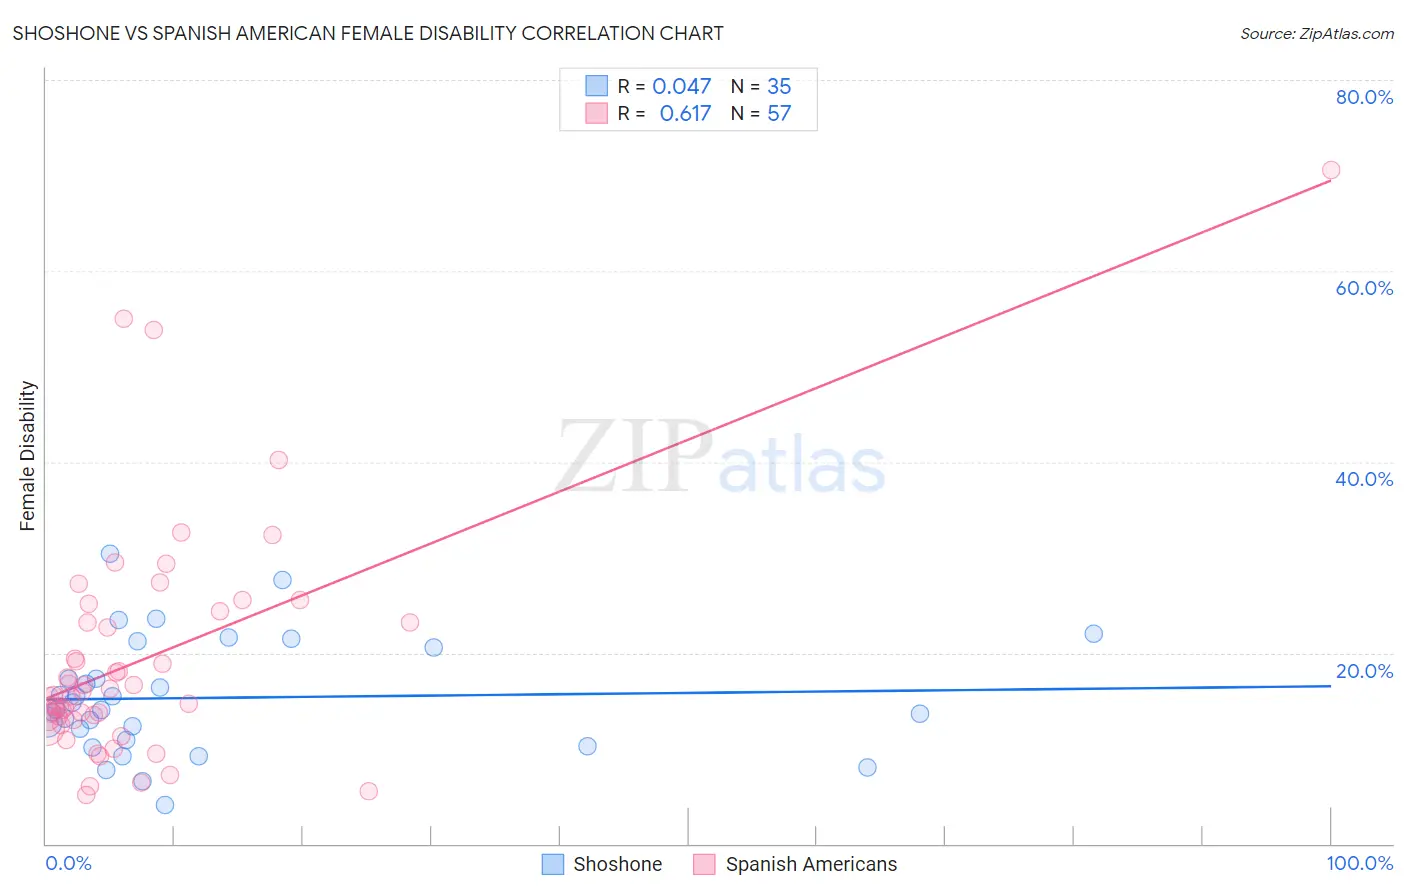
Shoshone vs Spanish American Female Disability Correlation Chart
The statistical analysis conducted on geographies consisting of 66,617,208 people shows no correlation between the proportion of Shoshone and percentage of females with a disability in the United States with a correlation coefficient (R) of 0.047 and weighted average of 13.2%. Similarly, the statistical analysis conducted on geographies consisting of 103,163,564 people shows a significant positive correlation between the proportion of Spanish Americans and percentage of females with a disability in the United States with a correlation coefficient (R) of 0.617 and weighted average of 14.0%, a difference of 5.8%.
Female Disability Correlation Summary
| Measurement | Shoshone | Spanish American |
| Minimum | 4.1% | 5.1% |
| Maximum | 30.3% | 70.6% |
| Range | 26.2% | 65.5% |
| Mean | 15.3% | 19.3% |
| Median | 14.1% | 15.6% |
| Interquartile 25% (IQ1) | 10.8% | 12.9% |
| Interquartile 75% (IQ3) | 20.5% | 23.8% |
| Interquartile Range (IQR) | 9.7% | 10.8% |
| Standard Deviation (Sample) | 6.0% | 12.2% |
| Standard Deviation (Population) | 5.9% | 12.1% |
Similar Demographics by Female Disability
Demographics Similar to Shoshone by Female Disability
In terms of female disability, the demographic groups most similar to Shoshone are Tlingit-Haida (13.2%, a difference of 0.060%), Immigrants from Yemen (13.2%, a difference of 0.060%), Yakama (13.2%, a difference of 0.17%), White/Caucasian (13.2%, a difference of 0.24%), and Yaqui (13.2%, a difference of 0.34%).
| Demographics | Rating | Rank | Female Disability |
| Hmong | 0.0 /100 | #284 | Tragic 13.1% |
| Bangladeshis | 0.0 /100 | #285 | Tragic 13.1% |
| Fijians | 0.0 /100 | #286 | Tragic 13.1% |
| Yaqui | 0.0 /100 | #287 | Tragic 13.2% |
| Whites/Caucasians | 0.0 /100 | #288 | Tragic 13.2% |
| Tlingit-Haida | 0.0 /100 | #289 | Tragic 13.2% |
| Immigrants | Yemen | 0.0 /100 | #290 | Tragic 13.2% |
| Shoshone | 0.0 /100 | #291 | Tragic 13.2% |
| Yakama | 0.0 /100 | #292 | Tragic 13.2% |
| Marshallese | 0.0 /100 | #293 | Tragic 13.3% |
| Celtics | 0.0 /100 | #294 | Tragic 13.3% |
| French | 0.0 /100 | #295 | Tragic 13.3% |
| Nepalese | 0.0 /100 | #296 | Tragic 13.3% |
| Slovaks | 0.0 /100 | #297 | Tragic 13.3% |
| Immigrants | Nonimmigrants | 0.0 /100 | #298 | Tragic 13.4% |
Demographics Similar to Spanish Americans by Female Disability
In terms of female disability, the demographic groups most similar to Spanish Americans are Chippewa (14.0%, a difference of 0.11%), Paiute (14.0%, a difference of 0.22%), Alaskan Athabascan (13.9%, a difference of 0.36%), Iroquois (14.0%, a difference of 0.50%), and American (14.1%, a difference of 0.85%).
| Demographics | Rating | Rank | Female Disability |
| French American Indians | 0.0 /100 | #309 | Tragic 13.7% |
| Apache | 0.0 /100 | #310 | Tragic 13.7% |
| Hopi | 0.0 /100 | #311 | Tragic 13.7% |
| Delaware | 0.0 /100 | #312 | Tragic 13.8% |
| Blackfeet | 0.0 /100 | #313 | Tragic 13.8% |
| Puget Sound Salish | 0.0 /100 | #314 | Tragic 13.8% |
| Alaskan Athabascans | 0.0 /100 | #315 | Tragic 13.9% |
| Spanish Americans | 0.0 /100 | #316 | Tragic 14.0% |
| Chippewa | 0.0 /100 | #317 | Tragic 14.0% |
| Paiute | 0.0 /100 | #318 | Tragic 14.0% |
| Iroquois | 0.0 /100 | #319 | Tragic 14.0% |
| Americans | 0.0 /100 | #320 | Tragic 14.1% |
| Potawatomi | 0.0 /100 | #321 | Tragic 14.1% |
| Pueblo | 0.0 /100 | #322 | Tragic 14.1% |
| Blacks/African Americans | 0.0 /100 | #323 | Tragic 14.1% |