Seminole vs Ugandan Ambulatory Disability
COMPARE
Seminole
Ugandan
Ambulatory Disability
Ambulatory Disability Comparison
Seminole
Ugandans
8.0%
AMBULATORY DISABILITY
0.0/ 100
METRIC RATING
336th/ 347
METRIC RANK
5.7%
AMBULATORY DISABILITY
99.2/ 100
METRIC RATING
84th/ 347
METRIC RANK
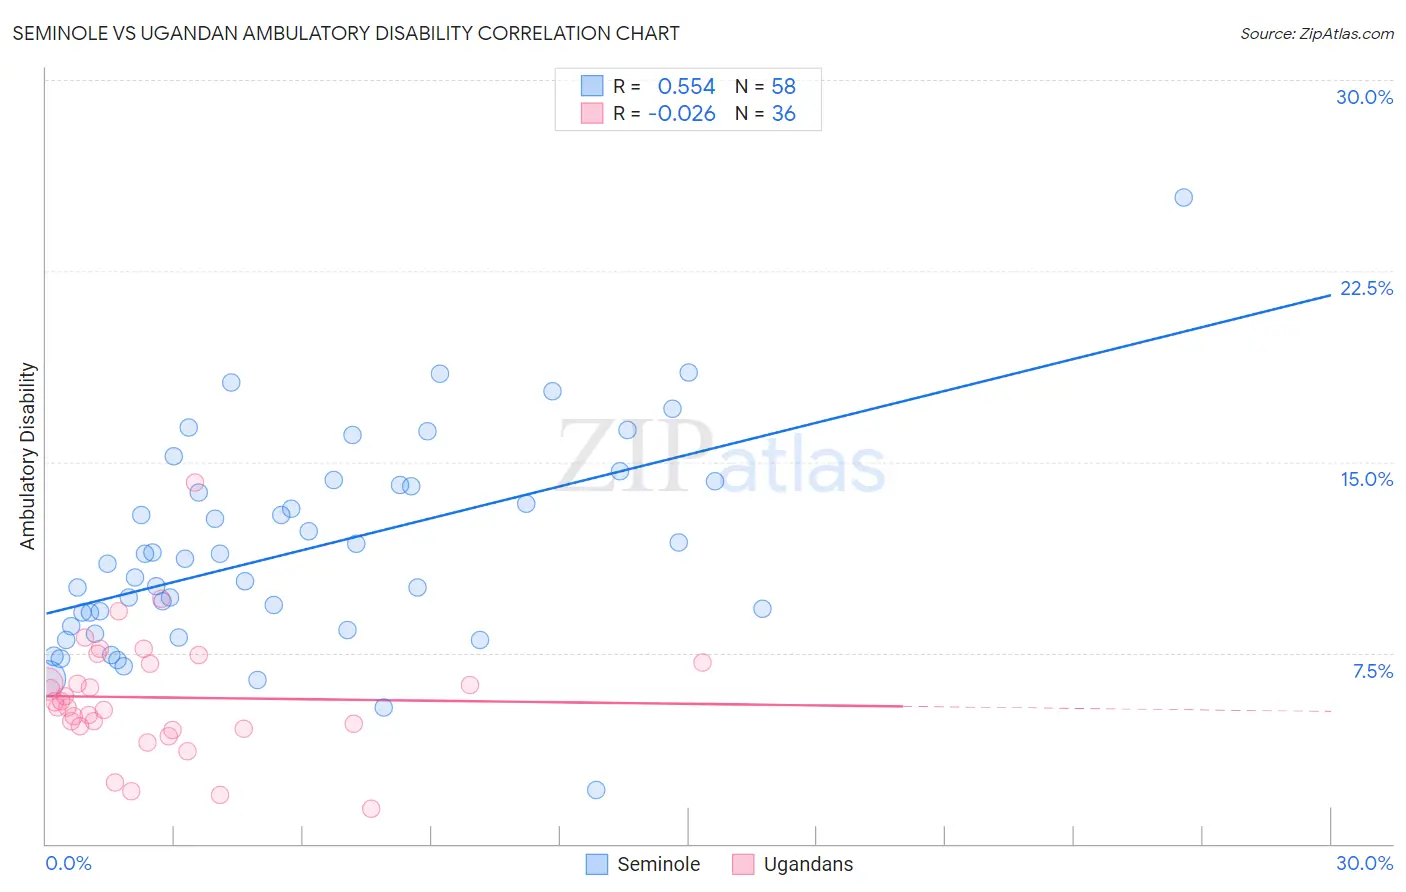
Seminole vs Ugandan Ambulatory Disability Correlation Chart
The statistical analysis conducted on geographies consisting of 118,301,825 people shows a substantial positive correlation between the proportion of Seminole and percentage of population with ambulatory disability in the United States with a correlation coefficient (R) of 0.554 and weighted average of 8.0%. Similarly, the statistical analysis conducted on geographies consisting of 94,018,396 people shows no correlation between the proportion of Ugandans and percentage of population with ambulatory disability in the United States with a correlation coefficient (R) of -0.026 and weighted average of 5.7%, a difference of 40.3%.
Ambulatory Disability Correlation Summary
| Measurement | Seminole | Ugandan |
| Minimum | 2.1% | 1.4% |
| Maximum | 25.4% | 14.2% |
| Range | 23.3% | 12.8% |
| Mean | 11.5% | 5.7% |
| Median | 11.1% | 5.5% |
| Interquartile 25% (IQ1) | 8.5% | 4.6% |
| Interquartile 75% (IQ3) | 14.1% | 7.1% |
| Interquartile Range (IQR) | 5.5% | 2.5% |
| Standard Deviation (Sample) | 4.1% | 2.4% |
| Standard Deviation (Population) | 4.0% | 2.3% |
Similar Demographics by Ambulatory Disability
Demographics Similar to Seminole by Ambulatory Disability
In terms of ambulatory disability, the demographic groups most similar to Seminole are Chickasaw (8.0%, a difference of 0.070%), Yuman (7.9%, a difference of 1.2%), Dutch West Indian (8.2%, a difference of 1.6%), Cherokee (7.9%, a difference of 2.1%), and Colville (8.2%, a difference of 2.2%).
| Demographics | Rating | Rank | Ambulatory Disability |
| Pueblo | 0.0 /100 | #329 | Tragic 7.6% |
| Paiute | 0.0 /100 | #330 | Tragic 7.7% |
| Cajuns | 0.0 /100 | #331 | Tragic 7.8% |
| Menominee | 0.0 /100 | #332 | Tragic 7.8% |
| Cherokee | 0.0 /100 | #333 | Tragic 7.9% |
| Yuman | 0.0 /100 | #334 | Tragic 7.9% |
| Chickasaw | 0.0 /100 | #335 | Tragic 8.0% |
| Seminole | 0.0 /100 | #336 | Tragic 8.0% |
| Dutch West Indians | 0.0 /100 | #337 | Tragic 8.2% |
| Colville | 0.0 /100 | #338 | Tragic 8.2% |
| Pima | 0.0 /100 | #339 | Tragic 8.2% |
| Choctaw | 0.0 /100 | #340 | Tragic 8.3% |
| Creek | 0.0 /100 | #341 | Tragic 8.5% |
| Kiowa | 0.0 /100 | #342 | Tragic 8.6% |
| Tohono O'odham | 0.0 /100 | #343 | Tragic 8.7% |
Demographics Similar to Ugandans by Ambulatory Disability
In terms of ambulatory disability, the demographic groups most similar to Ugandans are Eastern European (5.7%, a difference of 0.0%), Palestinian (5.7%, a difference of 0.020%), Immigrants from Ireland (5.7%, a difference of 0.030%), Immigrants from Jordan (5.7%, a difference of 0.030%), and Chilean (5.7%, a difference of 0.16%).
| Demographics | Rating | Rank | Ambulatory Disability |
| Immigrants | Vietnam | 99.3 /100 | #77 | Exceptional 5.7% |
| Somalis | 99.2 /100 | #78 | Exceptional 5.7% |
| Chileans | 99.2 /100 | #79 | Exceptional 5.7% |
| Immigrants | Ireland | 99.2 /100 | #80 | Exceptional 5.7% |
| Immigrants | Jordan | 99.2 /100 | #81 | Exceptional 5.7% |
| Palestinians | 99.2 /100 | #82 | Exceptional 5.7% |
| Eastern Europeans | 99.2 /100 | #83 | Exceptional 5.7% |
| Ugandans | 99.2 /100 | #84 | Exceptional 5.7% |
| South Americans | 99.0 /100 | #85 | Exceptional 5.7% |
| Latvians | 99.0 /100 | #86 | Exceptional 5.7% |
| Immigrants | Chile | 98.9 /100 | #87 | Exceptional 5.8% |
| Soviet Union | 98.9 /100 | #88 | Exceptional 5.8% |
| Bhutanese | 98.8 /100 | #89 | Exceptional 5.8% |
| Australians | 98.8 /100 | #90 | Exceptional 5.8% |
| Immigrants | Sudan | 98.8 /100 | #91 | Exceptional 5.8% |