Native/Alaskan vs Ugandan Ambulatory Disability
COMPARE
Native/Alaskan
Ugandan
Ambulatory Disability
Ambulatory Disability Comparison
Natives/Alaskans
Ugandans
7.5%
AMBULATORY DISABILITY
0.0/ 100
METRIC RATING
327th/ 347
METRIC RANK
5.7%
AMBULATORY DISABILITY
99.2/ 100
METRIC RATING
84th/ 347
METRIC RANK
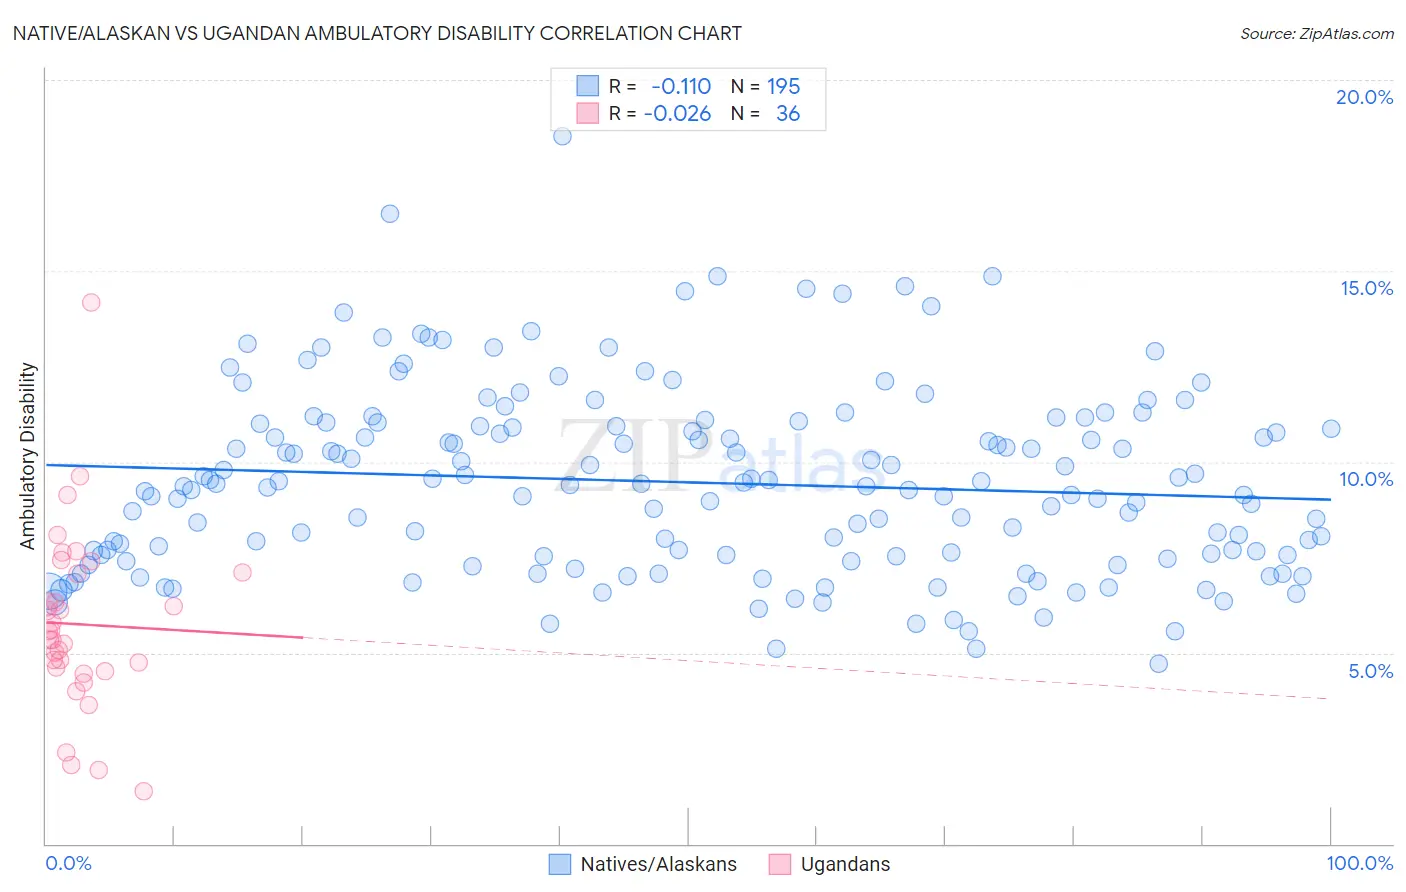
Native/Alaskan vs Ugandan Ambulatory Disability Correlation Chart
The statistical analysis conducted on geographies consisting of 512,715,386 people shows a poor negative correlation between the proportion of Natives/Alaskans and percentage of population with ambulatory disability in the United States with a correlation coefficient (R) of -0.110 and weighted average of 7.5%. Similarly, the statistical analysis conducted on geographies consisting of 94,018,396 people shows no correlation between the proportion of Ugandans and percentage of population with ambulatory disability in the United States with a correlation coefficient (R) of -0.026 and weighted average of 5.7%, a difference of 31.2%.
Ambulatory Disability Correlation Summary
| Measurement | Native/Alaskan | Ugandan |
| Minimum | 4.7% | 1.4% |
| Maximum | 18.5% | 14.2% |
| Range | 13.8% | 12.8% |
| Mean | 9.5% | 5.7% |
| Median | 9.4% | 5.5% |
| Interquartile 25% (IQ1) | 7.5% | 4.6% |
| Interquartile 75% (IQ3) | 11.0% | 7.1% |
| Interquartile Range (IQR) | 3.5% | 2.5% |
| Standard Deviation (Sample) | 2.4% | 2.4% |
| Standard Deviation (Population) | 2.4% | 2.3% |
Similar Demographics by Ambulatory Disability
Demographics Similar to Natives/Alaskans by Ambulatory Disability
In terms of ambulatory disability, the demographic groups most similar to Natives/Alaskans are Black/African American (7.5%, a difference of 0.010%), Comanche (7.5%, a difference of 0.12%), Navajo (7.5%, a difference of 0.20%), Hopi (7.6%, a difference of 0.94%), and Pueblo (7.6%, a difference of 0.98%).
| Demographics | Rating | Rank | Ambulatory Disability |
| Potawatomi | 0.0 /100 | #320 | Tragic 7.3% |
| Apache | 0.0 /100 | #321 | Tragic 7.4% |
| Osage | 0.0 /100 | #322 | Tragic 7.4% |
| Americans | 0.0 /100 | #323 | Tragic 7.4% |
| Navajo | 0.0 /100 | #324 | Tragic 7.5% |
| Comanche | 0.0 /100 | #325 | Tragic 7.5% |
| Blacks/African Americans | 0.0 /100 | #326 | Tragic 7.5% |
| Natives/Alaskans | 0.0 /100 | #327 | Tragic 7.5% |
| Hopi | 0.0 /100 | #328 | Tragic 7.6% |
| Pueblo | 0.0 /100 | #329 | Tragic 7.6% |
| Paiute | 0.0 /100 | #330 | Tragic 7.7% |
| Cajuns | 0.0 /100 | #331 | Tragic 7.8% |
| Menominee | 0.0 /100 | #332 | Tragic 7.8% |
| Cherokee | 0.0 /100 | #333 | Tragic 7.9% |
| Yuman | 0.0 /100 | #334 | Tragic 7.9% |
Demographics Similar to Ugandans by Ambulatory Disability
In terms of ambulatory disability, the demographic groups most similar to Ugandans are Eastern European (5.7%, a difference of 0.0%), Palestinian (5.7%, a difference of 0.020%), Immigrants from Ireland (5.7%, a difference of 0.030%), Immigrants from Jordan (5.7%, a difference of 0.030%), and Chilean (5.7%, a difference of 0.16%).
| Demographics | Rating | Rank | Ambulatory Disability |
| Immigrants | Vietnam | 99.3 /100 | #77 | Exceptional 5.7% |
| Somalis | 99.2 /100 | #78 | Exceptional 5.7% |
| Chileans | 99.2 /100 | #79 | Exceptional 5.7% |
| Immigrants | Ireland | 99.2 /100 | #80 | Exceptional 5.7% |
| Immigrants | Jordan | 99.2 /100 | #81 | Exceptional 5.7% |
| Palestinians | 99.2 /100 | #82 | Exceptional 5.7% |
| Eastern Europeans | 99.2 /100 | #83 | Exceptional 5.7% |
| Ugandans | 99.2 /100 | #84 | Exceptional 5.7% |
| South Americans | 99.0 /100 | #85 | Exceptional 5.7% |
| Latvians | 99.0 /100 | #86 | Exceptional 5.7% |
| Immigrants | Chile | 98.9 /100 | #87 | Exceptional 5.8% |
| Soviet Union | 98.9 /100 | #88 | Exceptional 5.8% |
| Bhutanese | 98.8 /100 | #89 | Exceptional 5.8% |
| Australians | 98.8 /100 | #90 | Exceptional 5.8% |
| Immigrants | Sudan | 98.8 /100 | #91 | Exceptional 5.8% |