Fijian vs Ugandan Ambulatory Disability
COMPARE
Fijian
Ugandan
Ambulatory Disability
Ambulatory Disability Comparison
Fijians
Ugandans
6.8%
AMBULATORY DISABILITY
0.0/ 100
METRIC RATING
285th/ 347
METRIC RANK
5.7%
AMBULATORY DISABILITY
99.2/ 100
METRIC RATING
84th/ 347
METRIC RANK
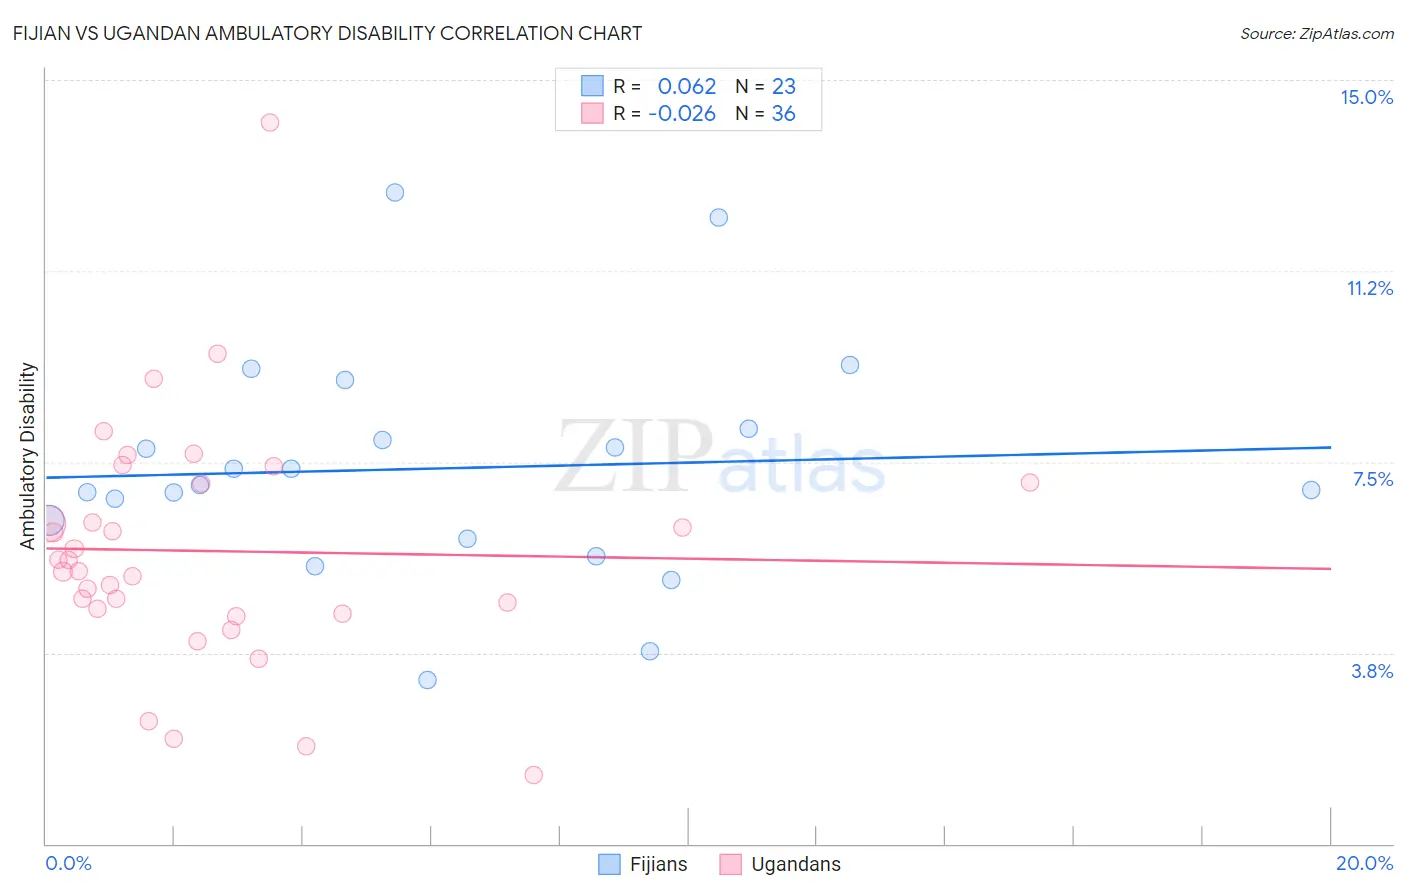
Fijian vs Ugandan Ambulatory Disability Correlation Chart
The statistical analysis conducted on geographies consisting of 55,947,275 people shows a slight positive correlation between the proportion of Fijians and percentage of population with ambulatory disability in the United States with a correlation coefficient (R) of 0.062 and weighted average of 6.8%. Similarly, the statistical analysis conducted on geographies consisting of 94,018,396 people shows no correlation between the proportion of Ugandans and percentage of population with ambulatory disability in the United States with a correlation coefficient (R) of -0.026 and weighted average of 5.7%, a difference of 18.8%.
Ambulatory Disability Correlation Summary
| Measurement | Fijian | Ugandan |
| Minimum | 3.2% | 1.4% |
| Maximum | 12.8% | 14.2% |
| Range | 9.6% | 12.8% |
| Mean | 7.4% | 5.7% |
| Median | 7.1% | 5.5% |
| Interquartile 25% (IQ1) | 6.0% | 4.6% |
| Interquartile 75% (IQ3) | 8.2% | 7.1% |
| Interquartile Range (IQR) | 2.2% | 2.5% |
| Standard Deviation (Sample) | 2.3% | 2.4% |
| Standard Deviation (Population) | 2.2% | 2.3% |
Similar Demographics by Ambulatory Disability
Demographics Similar to Fijians by Ambulatory Disability
In terms of ambulatory disability, the demographic groups most similar to Fijians are Yakama (6.8%, a difference of 0.040%), U.S. Virgin Islander (6.8%, a difference of 0.36%), Immigrants from Jamaica (6.8%, a difference of 0.41%), Immigrants from Barbados (6.8%, a difference of 0.48%), and Barbadian (6.8%, a difference of 0.64%).
| Demographics | Rating | Rank | Ambulatory Disability |
| Immigrants | West Indies | 0.1 /100 | #278 | Tragic 6.7% |
| Immigrants | Caribbean | 0.0 /100 | #279 | Tragic 6.7% |
| Pennsylvania Germans | 0.0 /100 | #280 | Tragic 6.8% |
| Yaqui | 0.0 /100 | #281 | Tragic 6.8% |
| Barbadians | 0.0 /100 | #282 | Tragic 6.8% |
| Immigrants | Barbados | 0.0 /100 | #283 | Tragic 6.8% |
| Immigrants | Jamaica | 0.0 /100 | #284 | Tragic 6.8% |
| Fijians | 0.0 /100 | #285 | Tragic 6.8% |
| Yakama | 0.0 /100 | #286 | Tragic 6.8% |
| U.S. Virgin Islanders | 0.0 /100 | #287 | Tragic 6.8% |
| Immigrants | Nonimmigrants | 0.0 /100 | #288 | Tragic 6.9% |
| Immigrants | Dominica | 0.0 /100 | #289 | Tragic 6.9% |
| Scotch-Irish | 0.0 /100 | #290 | Tragic 6.9% |
| West Indians | 0.0 /100 | #291 | Tragic 6.9% |
| Cheyenne | 0.0 /100 | #292 | Tragic 6.9% |
Demographics Similar to Ugandans by Ambulatory Disability
In terms of ambulatory disability, the demographic groups most similar to Ugandans are Eastern European (5.7%, a difference of 0.0%), Palestinian (5.7%, a difference of 0.020%), Immigrants from Ireland (5.7%, a difference of 0.030%), Immigrants from Jordan (5.7%, a difference of 0.030%), and Chilean (5.7%, a difference of 0.16%).
| Demographics | Rating | Rank | Ambulatory Disability |
| Immigrants | Vietnam | 99.3 /100 | #77 | Exceptional 5.7% |
| Somalis | 99.2 /100 | #78 | Exceptional 5.7% |
| Chileans | 99.2 /100 | #79 | Exceptional 5.7% |
| Immigrants | Ireland | 99.2 /100 | #80 | Exceptional 5.7% |
| Immigrants | Jordan | 99.2 /100 | #81 | Exceptional 5.7% |
| Palestinians | 99.2 /100 | #82 | Exceptional 5.7% |
| Eastern Europeans | 99.2 /100 | #83 | Exceptional 5.7% |
| Ugandans | 99.2 /100 | #84 | Exceptional 5.7% |
| South Americans | 99.0 /100 | #85 | Exceptional 5.7% |
| Latvians | 99.0 /100 | #86 | Exceptional 5.7% |
| Immigrants | Chile | 98.9 /100 | #87 | Exceptional 5.8% |
| Soviet Union | 98.9 /100 | #88 | Exceptional 5.8% |
| Bhutanese | 98.8 /100 | #89 | Exceptional 5.8% |
| Australians | 98.8 /100 | #90 | Exceptional 5.8% |
| Immigrants | Sudan | 98.8 /100 | #91 | Exceptional 5.8% |