Seminole vs Asian Ambulatory Disability
COMPARE
Seminole
Asian
Ambulatory Disability
Ambulatory Disability Comparison
Seminole
Asians
8.0%
AMBULATORY DISABILITY
0.0/ 100
METRIC RATING
336th/ 347
METRIC RANK
5.4%
AMBULATORY DISABILITY
100.0/ 100
METRIC RATING
27th/ 347
METRIC RANK
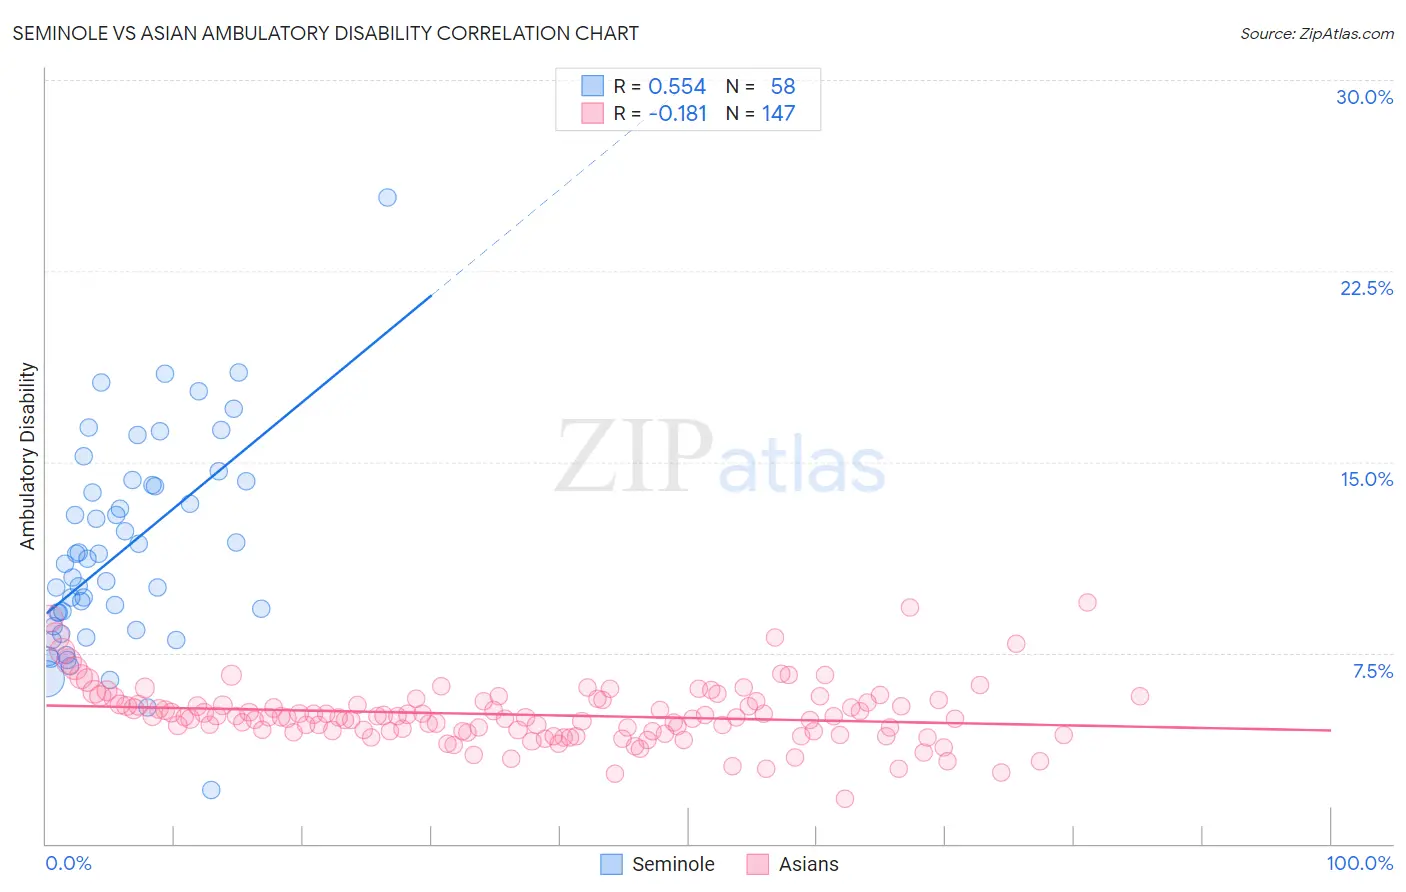
Seminole vs Asian Ambulatory Disability Correlation Chart
The statistical analysis conducted on geographies consisting of 118,301,825 people shows a substantial positive correlation between the proportion of Seminole and percentage of population with ambulatory disability in the United States with a correlation coefficient (R) of 0.554 and weighted average of 8.0%. Similarly, the statistical analysis conducted on geographies consisting of 550,442,799 people shows a poor negative correlation between the proportion of Asians and percentage of population with ambulatory disability in the United States with a correlation coefficient (R) of -0.181 and weighted average of 5.4%, a difference of 48.8%.
Ambulatory Disability Correlation Summary
| Measurement | Seminole | Asian |
| Minimum | 2.1% | 1.8% |
| Maximum | 25.4% | 9.5% |
| Range | 23.3% | 7.7% |
| Mean | 11.5% | 5.1% |
| Median | 11.1% | 5.0% |
| Interquartile 25% (IQ1) | 8.5% | 4.4% |
| Interquartile 75% (IQ3) | 14.1% | 5.6% |
| Interquartile Range (IQR) | 5.5% | 1.2% |
| Standard Deviation (Sample) | 4.1% | 1.2% |
| Standard Deviation (Population) | 4.0% | 1.2% |
Similar Demographics by Ambulatory Disability
Demographics Similar to Seminole by Ambulatory Disability
In terms of ambulatory disability, the demographic groups most similar to Seminole are Chickasaw (8.0%, a difference of 0.070%), Yuman (7.9%, a difference of 1.2%), Dutch West Indian (8.2%, a difference of 1.6%), Cherokee (7.9%, a difference of 2.1%), and Colville (8.2%, a difference of 2.2%).
| Demographics | Rating | Rank | Ambulatory Disability |
| Pueblo | 0.0 /100 | #329 | Tragic 7.6% |
| Paiute | 0.0 /100 | #330 | Tragic 7.7% |
| Cajuns | 0.0 /100 | #331 | Tragic 7.8% |
| Menominee | 0.0 /100 | #332 | Tragic 7.8% |
| Cherokee | 0.0 /100 | #333 | Tragic 7.9% |
| Yuman | 0.0 /100 | #334 | Tragic 7.9% |
| Chickasaw | 0.0 /100 | #335 | Tragic 8.0% |
| Seminole | 0.0 /100 | #336 | Tragic 8.0% |
| Dutch West Indians | 0.0 /100 | #337 | Tragic 8.2% |
| Colville | 0.0 /100 | #338 | Tragic 8.2% |
| Pima | 0.0 /100 | #339 | Tragic 8.2% |
| Choctaw | 0.0 /100 | #340 | Tragic 8.3% |
| Creek | 0.0 /100 | #341 | Tragic 8.5% |
| Kiowa | 0.0 /100 | #342 | Tragic 8.6% |
| Tohono O'odham | 0.0 /100 | #343 | Tragic 8.7% |
Demographics Similar to Asians by Ambulatory Disability
In terms of ambulatory disability, the demographic groups most similar to Asians are Cambodian (5.4%, a difference of 0.060%), Immigrants from Nepal (5.4%, a difference of 0.16%), Immigrants from Iran (5.4%, a difference of 0.16%), Zimbabwean (5.4%, a difference of 0.19%), and Immigrants from Saudi Arabia (5.4%, a difference of 0.27%).
| Demographics | Rating | Rank | Ambulatory Disability |
| Ethiopians | 100.0 /100 | #20 | Exceptional 5.4% |
| Immigrants | Kuwait | 100.0 /100 | #21 | Exceptional 5.4% |
| Immigrants | Israel | 100.0 /100 | #22 | Exceptional 5.4% |
| Tongans | 100.0 /100 | #23 | Exceptional 5.4% |
| Immigrants | Saudi Arabia | 100.0 /100 | #24 | Exceptional 5.4% |
| Zimbabweans | 100.0 /100 | #25 | Exceptional 5.4% |
| Immigrants | Nepal | 100.0 /100 | #26 | Exceptional 5.4% |
| Asians | 100.0 /100 | #27 | Exceptional 5.4% |
| Cambodians | 100.0 /100 | #28 | Exceptional 5.4% |
| Immigrants | Iran | 100.0 /100 | #29 | Exceptional 5.4% |
| Immigrants | Turkey | 100.0 /100 | #30 | Exceptional 5.4% |
| Immigrants | Venezuela | 100.0 /100 | #31 | Exceptional 5.4% |
| Immigrants | Australia | 100.0 /100 | #32 | Exceptional 5.5% |
| Immigrants | Pakistan | 100.0 /100 | #33 | Exceptional 5.5% |
| Immigrants | Asia | 100.0 /100 | #34 | Exceptional 5.5% |