Seminole vs Jordanian Ambulatory Disability
COMPARE
Seminole
Jordanian
Ambulatory Disability
Ambulatory Disability Comparison
Seminole
Jordanians
8.0%
AMBULATORY DISABILITY
0.0/ 100
METRIC RATING
336th/ 347
METRIC RANK
5.6%
AMBULATORY DISABILITY
99.8/ 100
METRIC RATING
52nd/ 347
METRIC RANK
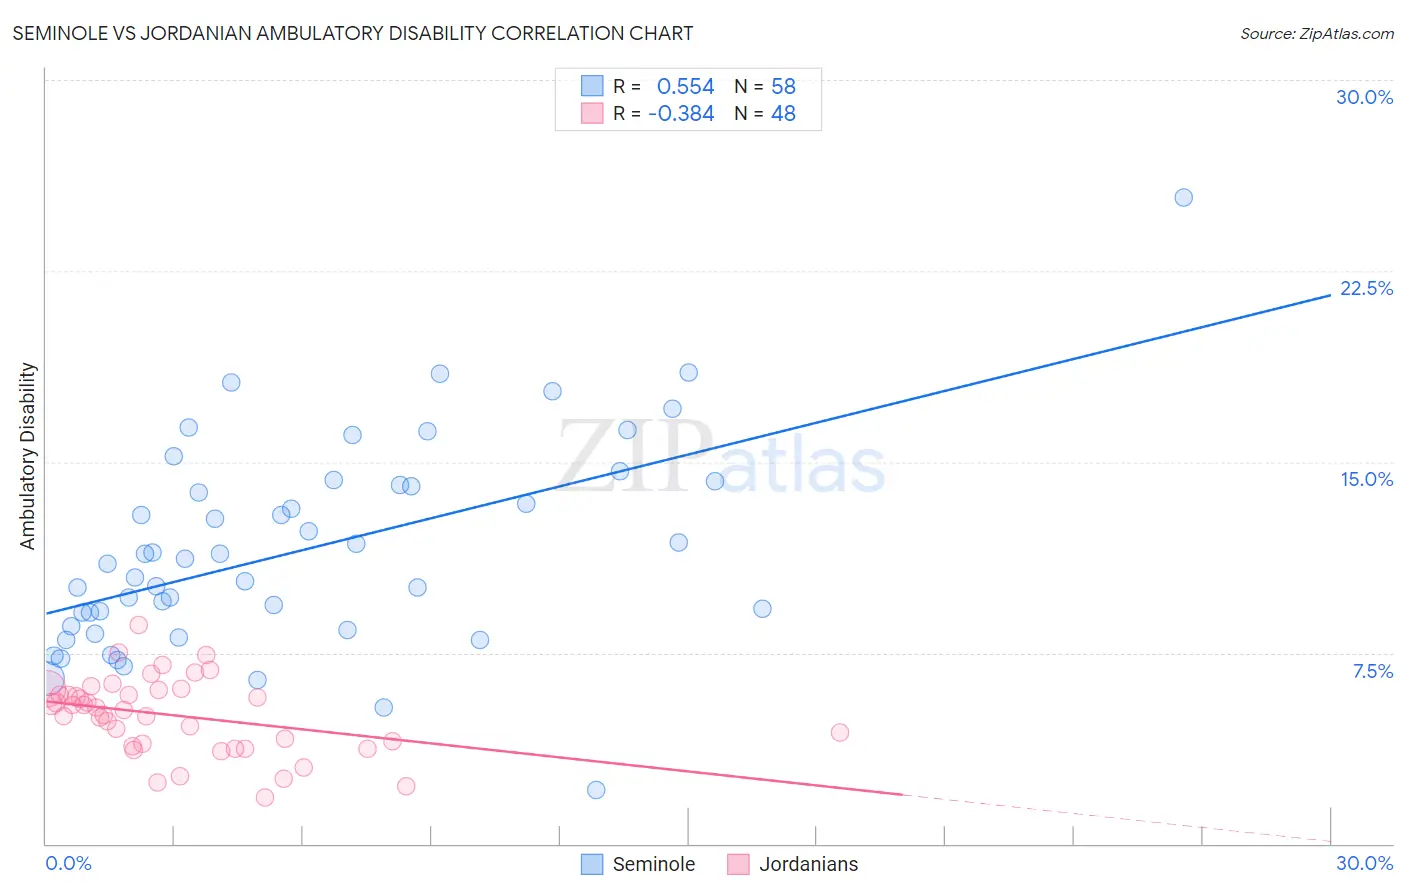
Seminole vs Jordanian Ambulatory Disability Correlation Chart
The statistical analysis conducted on geographies consisting of 118,301,825 people shows a substantial positive correlation between the proportion of Seminole and percentage of population with ambulatory disability in the United States with a correlation coefficient (R) of 0.554 and weighted average of 8.0%. Similarly, the statistical analysis conducted on geographies consisting of 166,412,494 people shows a mild negative correlation between the proportion of Jordanians and percentage of population with ambulatory disability in the United States with a correlation coefficient (R) of -0.384 and weighted average of 5.6%, a difference of 43.6%.
Ambulatory Disability Correlation Summary
| Measurement | Seminole | Jordanian |
| Minimum | 2.1% | 1.8% |
| Maximum | 25.4% | 8.6% |
| Range | 23.3% | 6.8% |
| Mean | 11.5% | 5.0% |
| Median | 11.1% | 5.3% |
| Interquartile 25% (IQ1) | 8.5% | 3.9% |
| Interquartile 75% (IQ3) | 14.1% | 5.9% |
| Interquartile Range (IQR) | 5.5% | 2.1% |
| Standard Deviation (Sample) | 4.1% | 1.5% |
| Standard Deviation (Population) | 4.0% | 1.5% |
Similar Demographics by Ambulatory Disability
Demographics Similar to Seminole by Ambulatory Disability
In terms of ambulatory disability, the demographic groups most similar to Seminole are Chickasaw (8.0%, a difference of 0.070%), Yuman (7.9%, a difference of 1.2%), Dutch West Indian (8.2%, a difference of 1.6%), Cherokee (7.9%, a difference of 2.1%), and Colville (8.2%, a difference of 2.2%).
| Demographics | Rating | Rank | Ambulatory Disability |
| Pueblo | 0.0 /100 | #329 | Tragic 7.6% |
| Paiute | 0.0 /100 | #330 | Tragic 7.7% |
| Cajuns | 0.0 /100 | #331 | Tragic 7.8% |
| Menominee | 0.0 /100 | #332 | Tragic 7.8% |
| Cherokee | 0.0 /100 | #333 | Tragic 7.9% |
| Yuman | 0.0 /100 | #334 | Tragic 7.9% |
| Chickasaw | 0.0 /100 | #335 | Tragic 8.0% |
| Seminole | 0.0 /100 | #336 | Tragic 8.0% |
| Dutch West Indians | 0.0 /100 | #337 | Tragic 8.2% |
| Colville | 0.0 /100 | #338 | Tragic 8.2% |
| Pima | 0.0 /100 | #339 | Tragic 8.2% |
| Choctaw | 0.0 /100 | #340 | Tragic 8.3% |
| Creek | 0.0 /100 | #341 | Tragic 8.5% |
| Kiowa | 0.0 /100 | #342 | Tragic 8.6% |
| Tohono O'odham | 0.0 /100 | #343 | Tragic 8.7% |
Demographics Similar to Jordanians by Ambulatory Disability
In terms of ambulatory disability, the demographic groups most similar to Jordanians are Immigrants from Egypt (5.6%, a difference of 0.010%), Immigrants from Eastern Africa (5.6%, a difference of 0.060%), Taiwanese (5.6%, a difference of 0.090%), Immigrants from Bulgaria (5.6%, a difference of 0.12%), and Luxembourger (5.6%, a difference of 0.19%).
| Demographics | Rating | Rank | Ambulatory Disability |
| Immigrants | Sweden | 99.9 /100 | #45 | Exceptional 5.6% |
| Egyptians | 99.9 /100 | #46 | Exceptional 5.6% |
| Immigrants | Japan | 99.9 /100 | #47 | Exceptional 5.6% |
| Immigrants | Argentina | 99.9 /100 | #48 | Exceptional 5.6% |
| Bulgarians | 99.9 /100 | #49 | Exceptional 5.6% |
| Luxembourgers | 99.9 /100 | #50 | Exceptional 5.6% |
| Taiwanese | 99.8 /100 | #51 | Exceptional 5.6% |
| Jordanians | 99.8 /100 | #52 | Exceptional 5.6% |
| Immigrants | Egypt | 99.8 /100 | #53 | Exceptional 5.6% |
| Immigrants | Eastern Africa | 99.8 /100 | #54 | Exceptional 5.6% |
| Immigrants | Bulgaria | 99.8 /100 | #55 | Exceptional 5.6% |
| Inupiat | 99.8 /100 | #56 | Exceptional 5.6% |
| Immigrants | Brazil | 99.8 /100 | #57 | Exceptional 5.6% |
| Immigrants | Zimbabwe | 99.8 /100 | #58 | Exceptional 5.6% |
| Immigrants | Afghanistan | 99.8 /100 | #59 | Exceptional 5.6% |