Seminole vs Macedonian Ambulatory Disability
COMPARE
Seminole
Macedonian
Ambulatory Disability
Ambulatory Disability Comparison
Seminole
Macedonians
8.0%
AMBULATORY DISABILITY
0.0/ 100
METRIC RATING
336th/ 347
METRIC RANK
6.0%
AMBULATORY DISABILITY
82.8/ 100
METRIC RATING
144th/ 347
METRIC RANK
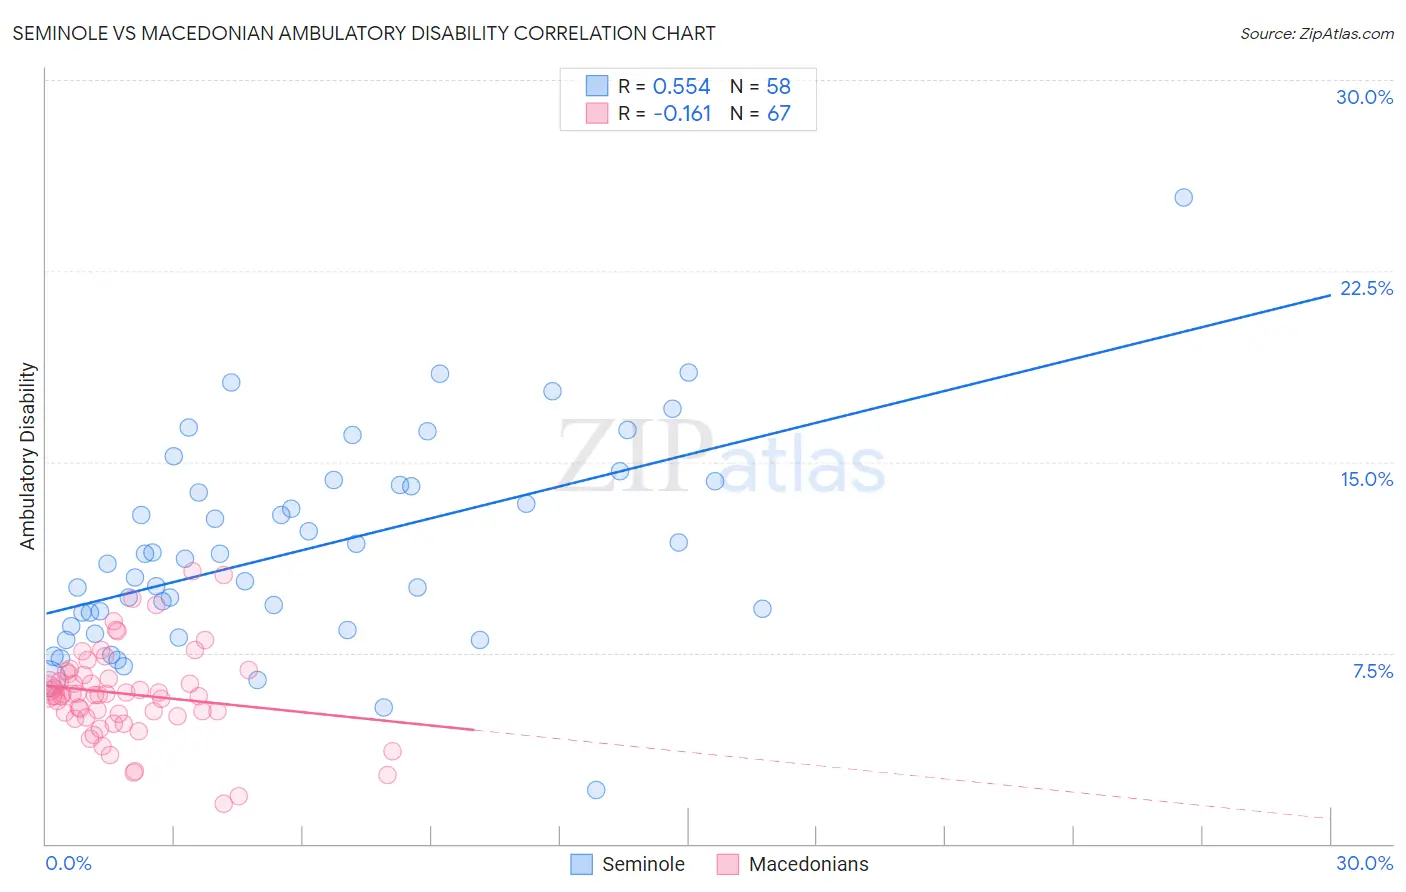
Seminole vs Macedonian Ambulatory Disability Correlation Chart
The statistical analysis conducted on geographies consisting of 118,301,825 people shows a substantial positive correlation between the proportion of Seminole and percentage of population with ambulatory disability in the United States with a correlation coefficient (R) of 0.554 and weighted average of 8.0%. Similarly, the statistical analysis conducted on geographies consisting of 132,658,712 people shows a poor negative correlation between the proportion of Macedonians and percentage of population with ambulatory disability in the United States with a correlation coefficient (R) of -0.161 and weighted average of 6.0%, a difference of 34.2%.
Ambulatory Disability Correlation Summary
| Measurement | Seminole | Macedonian |
| Minimum | 2.1% | 1.6% |
| Maximum | 25.4% | 10.7% |
| Range | 23.3% | 9.1% |
| Mean | 11.5% | 5.9% |
| Median | 11.1% | 5.9% |
| Interquartile 25% (IQ1) | 8.5% | 5.0% |
| Interquartile 75% (IQ3) | 14.1% | 6.7% |
| Interquartile Range (IQR) | 5.5% | 1.7% |
| Standard Deviation (Sample) | 4.1% | 1.8% |
| Standard Deviation (Population) | 4.0% | 1.8% |
Similar Demographics by Ambulatory Disability
Demographics Similar to Seminole by Ambulatory Disability
In terms of ambulatory disability, the demographic groups most similar to Seminole are Chickasaw (8.0%, a difference of 0.070%), Yuman (7.9%, a difference of 1.2%), Dutch West Indian (8.2%, a difference of 1.6%), Cherokee (7.9%, a difference of 2.1%), and Colville (8.2%, a difference of 2.2%).
| Demographics | Rating | Rank | Ambulatory Disability |
| Pueblo | 0.0 /100 | #329 | Tragic 7.6% |
| Paiute | 0.0 /100 | #330 | Tragic 7.7% |
| Cajuns | 0.0 /100 | #331 | Tragic 7.8% |
| Menominee | 0.0 /100 | #332 | Tragic 7.8% |
| Cherokee | 0.0 /100 | #333 | Tragic 7.9% |
| Yuman | 0.0 /100 | #334 | Tragic 7.9% |
| Chickasaw | 0.0 /100 | #335 | Tragic 8.0% |
| Seminole | 0.0 /100 | #336 | Tragic 8.0% |
| Dutch West Indians | 0.0 /100 | #337 | Tragic 8.2% |
| Colville | 0.0 /100 | #338 | Tragic 8.2% |
| Pima | 0.0 /100 | #339 | Tragic 8.2% |
| Choctaw | 0.0 /100 | #340 | Tragic 8.3% |
| Creek | 0.0 /100 | #341 | Tragic 8.5% |
| Kiowa | 0.0 /100 | #342 | Tragic 8.6% |
| Tohono O'odham | 0.0 /100 | #343 | Tragic 8.7% |
Demographics Similar to Macedonians by Ambulatory Disability
In terms of ambulatory disability, the demographic groups most similar to Macedonians are Romanian (6.0%, a difference of 0.010%), Immigrants from Philippines (6.0%, a difference of 0.020%), Swedish (6.0%, a difference of 0.030%), Pakistani (6.0%, a difference of 0.030%), and Immigrants from Greece (6.0%, a difference of 0.030%).
| Demographics | Rating | Rank | Ambulatory Disability |
| Immigrants | Syria | 84.1 /100 | #137 | Excellent 6.0% |
| Immigrants | Hungary | 83.9 /100 | #138 | Excellent 6.0% |
| Immigrants | Zaire | 83.6 /100 | #139 | Excellent 6.0% |
| Czechs | 83.3 /100 | #140 | Excellent 6.0% |
| Swedes | 83.1 /100 | #141 | Excellent 6.0% |
| Immigrants | Philippines | 83.0 /100 | #142 | Excellent 6.0% |
| Romanians | 82.9 /100 | #143 | Excellent 6.0% |
| Macedonians | 82.8 /100 | #144 | Excellent 6.0% |
| Pakistanis | 82.5 /100 | #145 | Excellent 6.0% |
| Immigrants | Greece | 82.5 /100 | #146 | Excellent 6.0% |
| Immigrants | Moldova | 82.4 /100 | #147 | Excellent 6.0% |
| Immigrants | Eastern Europe | 82.0 /100 | #148 | Excellent 6.0% |
| Lithuanians | 81.9 /100 | #149 | Excellent 6.0% |
| Maltese | 81.6 /100 | #150 | Excellent 6.0% |
| Greeks | 79.6 /100 | #151 | Good 6.0% |