Osage vs Ugandan Ambulatory Disability
COMPARE
Osage
Ugandan
Ambulatory Disability
Ambulatory Disability Comparison
Osage
Ugandans
7.4%
AMBULATORY DISABILITY
0.0/ 100
METRIC RATING
322nd/ 347
METRIC RANK
5.7%
AMBULATORY DISABILITY
99.2/ 100
METRIC RATING
84th/ 347
METRIC RANK
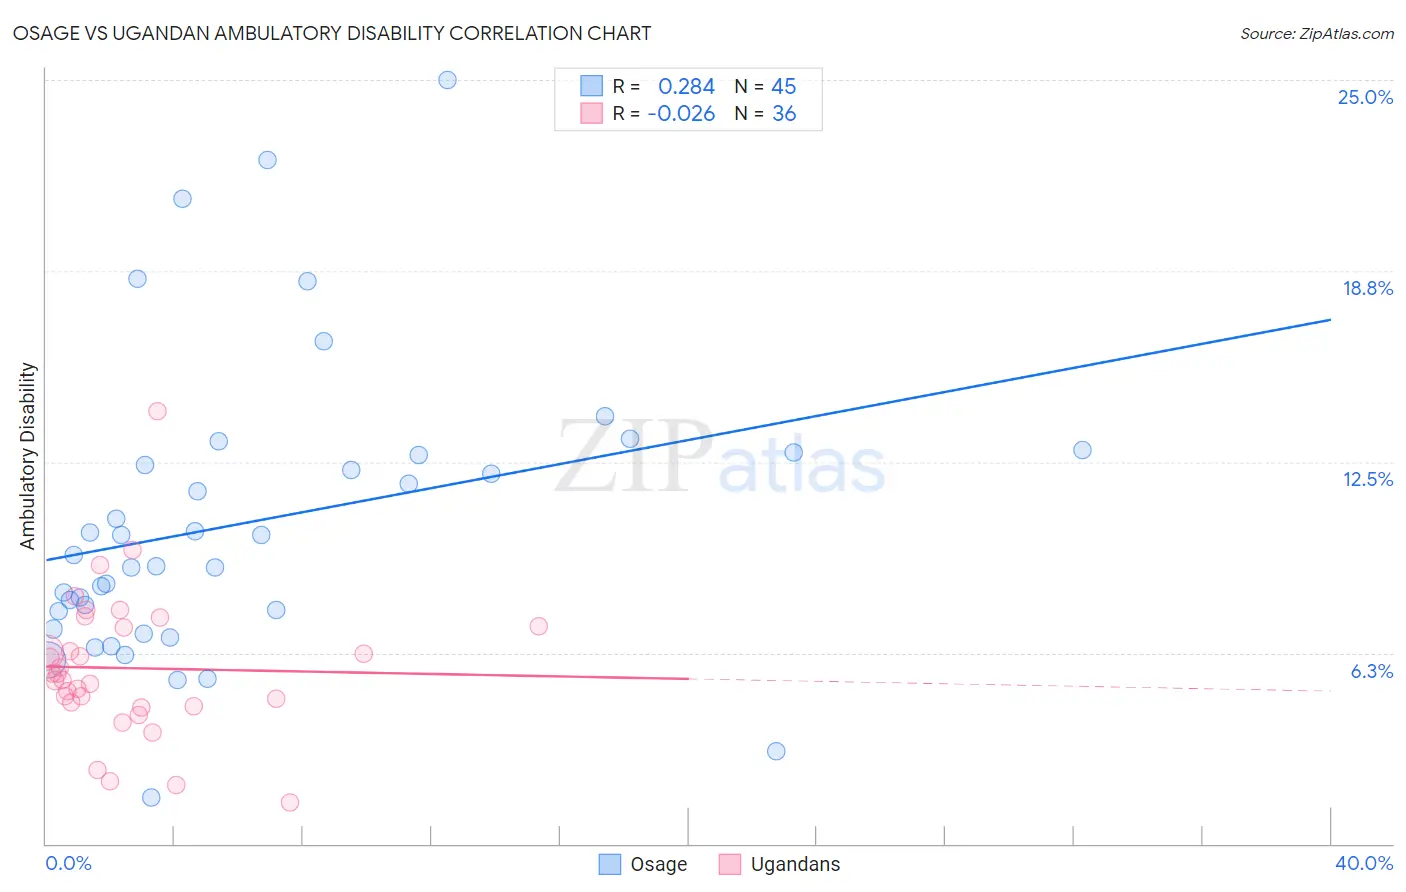
Osage vs Ugandan Ambulatory Disability Correlation Chart
The statistical analysis conducted on geographies consisting of 91,795,743 people shows a weak positive correlation between the proportion of Osage and percentage of population with ambulatory disability in the United States with a correlation coefficient (R) of 0.284 and weighted average of 7.4%. Similarly, the statistical analysis conducted on geographies consisting of 94,018,396 people shows no correlation between the proportion of Ugandans and percentage of population with ambulatory disability in the United States with a correlation coefficient (R) of -0.026 and weighted average of 5.7%, a difference of 28.9%.
Ambulatory Disability Correlation Summary
| Measurement | Osage | Ugandan |
| Minimum | 1.5% | 1.4% |
| Maximum | 25.0% | 14.2% |
| Range | 23.5% | 12.8% |
| Mean | 10.5% | 5.7% |
| Median | 9.5% | 5.5% |
| Interquartile 25% (IQ1) | 7.3% | 4.6% |
| Interquartile 75% (IQ3) | 12.8% | 7.1% |
| Interquartile Range (IQR) | 5.5% | 2.5% |
| Standard Deviation (Sample) | 4.9% | 2.4% |
| Standard Deviation (Population) | 4.8% | 2.3% |
Similar Demographics by Ambulatory Disability
Demographics Similar to Osage by Ambulatory Disability
In terms of ambulatory disability, the demographic groups most similar to Osage are Apache (7.4%, a difference of 0.14%), American (7.4%, a difference of 0.28%), Potawatomi (7.3%, a difference of 0.95%), Navajo (7.5%, a difference of 1.6%), and Comanche (7.5%, a difference of 1.7%).
| Demographics | Rating | Rank | Ambulatory Disability |
| Shoshone | 0.0 /100 | #315 | Tragic 7.1% |
| Immigrants | Dominican Republic | 0.0 /100 | #316 | Tragic 7.1% |
| Central American Indians | 0.0 /100 | #317 | Tragic 7.2% |
| Ottawa | 0.0 /100 | #318 | Tragic 7.2% |
| Dominicans | 0.0 /100 | #319 | Tragic 7.2% |
| Potawatomi | 0.0 /100 | #320 | Tragic 7.3% |
| Apache | 0.0 /100 | #321 | Tragic 7.4% |
| Osage | 0.0 /100 | #322 | Tragic 7.4% |
| Americans | 0.0 /100 | #323 | Tragic 7.4% |
| Navajo | 0.0 /100 | #324 | Tragic 7.5% |
| Comanche | 0.0 /100 | #325 | Tragic 7.5% |
| Blacks/African Americans | 0.0 /100 | #326 | Tragic 7.5% |
| Natives/Alaskans | 0.0 /100 | #327 | Tragic 7.5% |
| Hopi | 0.0 /100 | #328 | Tragic 7.6% |
| Pueblo | 0.0 /100 | #329 | Tragic 7.6% |
Demographics Similar to Ugandans by Ambulatory Disability
In terms of ambulatory disability, the demographic groups most similar to Ugandans are Eastern European (5.7%, a difference of 0.0%), Palestinian (5.7%, a difference of 0.020%), Immigrants from Ireland (5.7%, a difference of 0.030%), Immigrants from Jordan (5.7%, a difference of 0.030%), and Chilean (5.7%, a difference of 0.16%).
| Demographics | Rating | Rank | Ambulatory Disability |
| Immigrants | Vietnam | 99.3 /100 | #77 | Exceptional 5.7% |
| Somalis | 99.2 /100 | #78 | Exceptional 5.7% |
| Chileans | 99.2 /100 | #79 | Exceptional 5.7% |
| Immigrants | Ireland | 99.2 /100 | #80 | Exceptional 5.7% |
| Immigrants | Jordan | 99.2 /100 | #81 | Exceptional 5.7% |
| Palestinians | 99.2 /100 | #82 | Exceptional 5.7% |
| Eastern Europeans | 99.2 /100 | #83 | Exceptional 5.7% |
| Ugandans | 99.2 /100 | #84 | Exceptional 5.7% |
| South Americans | 99.0 /100 | #85 | Exceptional 5.7% |
| Latvians | 99.0 /100 | #86 | Exceptional 5.7% |
| Immigrants | Chile | 98.9 /100 | #87 | Exceptional 5.8% |
| Soviet Union | 98.9 /100 | #88 | Exceptional 5.8% |
| Bhutanese | 98.8 /100 | #89 | Exceptional 5.8% |
| Australians | 98.8 /100 | #90 | Exceptional 5.8% |
| Immigrants | Sudan | 98.8 /100 | #91 | Exceptional 5.8% |