Seminole vs Immigrants from Uruguay Disability Age Under 5
COMPARE
Seminole
Immigrants from Uruguay
Disability Age Under 5
Disability Age Under 5 Comparison
Seminole
Immigrants from Uruguay
1.6%
DISABILITY AGE UNDER 5
0.0/ 100
METRIC RATING
304th/ 347
METRIC RANK
1.2%
DISABILITY AGE UNDER 5
59.0/ 100
METRIC RATING
169th/ 347
METRIC RANK
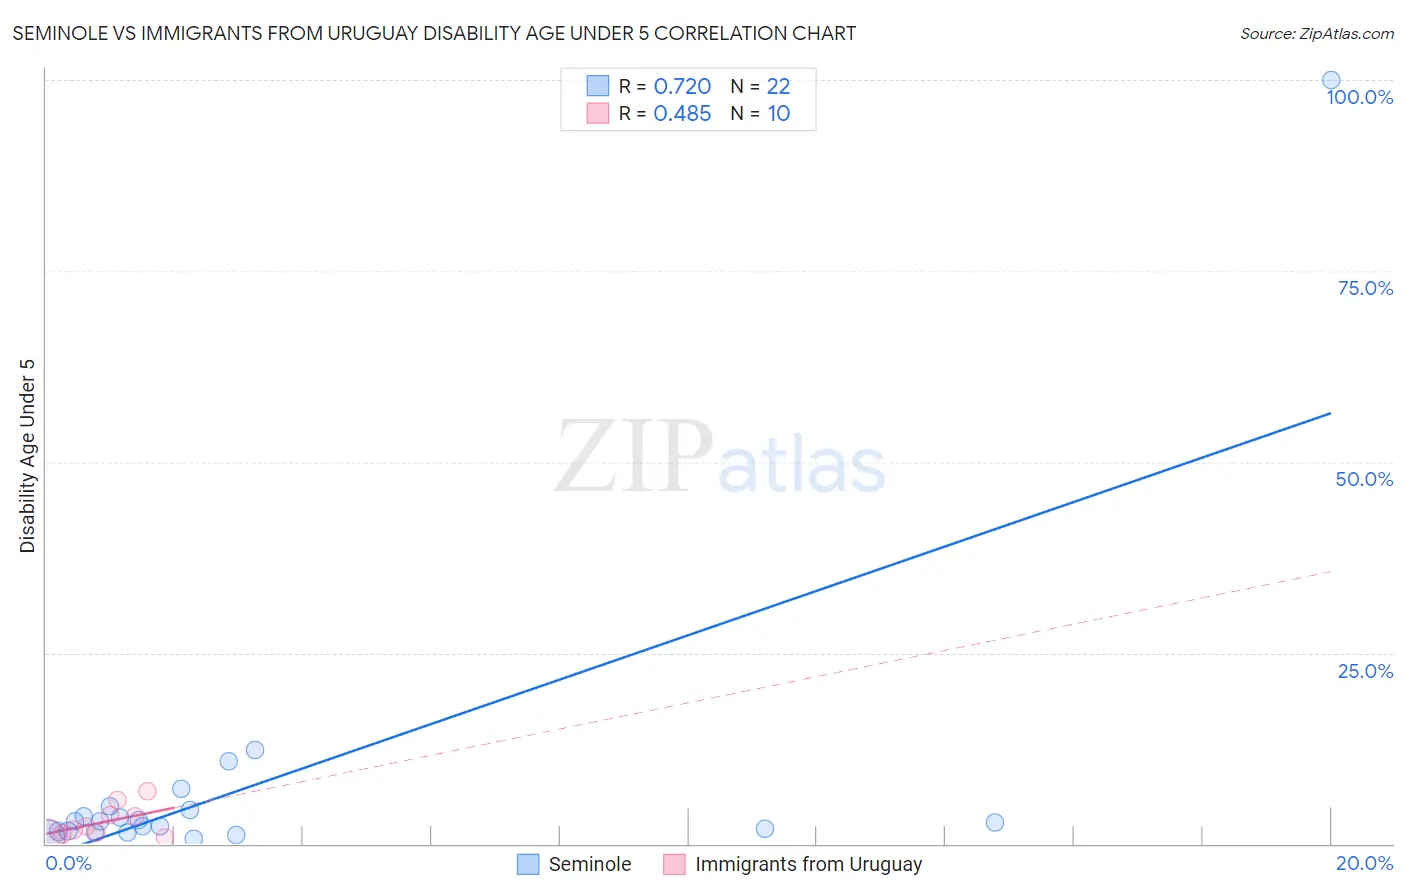
Seminole vs Immigrants from Uruguay Disability Age Under 5 Correlation Chart
The statistical analysis conducted on geographies consisting of 90,113,501 people shows a strong positive correlation between the proportion of Seminole and percentage of population with a disability under the age of 5 in the United States with a correlation coefficient (R) of 0.720 and weighted average of 1.6%. Similarly, the statistical analysis conducted on geographies consisting of 93,497,265 people shows a moderate positive correlation between the proportion of Immigrants from Uruguay and percentage of population with a disability under the age of 5 in the United States with a correlation coefficient (R) of 0.485 and weighted average of 1.2%, a difference of 33.6%.
Disability Age Under 5 Correlation Summary
| Measurement | Seminole | Immigrants from Uruguay |
| Minimum | 0.70% | 0.84% |
| Maximum | 100.0% | 6.8% |
| Range | 99.3% | 6.0% |
| Mean | 7.9% | 2.8% |
| Median | 2.9% | 2.0% |
| Interquartile 25% (IQ1) | 1.6% | 1.3% |
| Interquartile 75% (IQ3) | 4.4% | 3.8% |
| Interquartile Range (IQR) | 2.8% | 2.5% |
| Standard Deviation (Sample) | 20.8% | 2.1% |
| Standard Deviation (Population) | 20.3% | 2.0% |
Similar Demographics by Disability Age Under 5
Demographics Similar to Seminole by Disability Age Under 5
In terms of disability age under 5, the demographic groups most similar to Seminole are Blackfeet (1.6%, a difference of 0.16%), Creek (1.6%, a difference of 0.19%), Scottish (1.6%, a difference of 0.26%), Navajo (1.6%, a difference of 0.40%), and Swiss (1.6%, a difference of 0.63%).
| Demographics | Rating | Rank | Disability Age Under 5 |
| Immigrants | Nonimmigrants | 0.0 /100 | #297 | Tragic 1.6% |
| Cajuns | 0.0 /100 | #298 | Tragic 1.6% |
| Portuguese | 0.0 /100 | #299 | Tragic 1.6% |
| Shoshone | 0.0 /100 | #300 | Tragic 1.6% |
| German Russians | 0.0 /100 | #301 | Tragic 1.6% |
| Welsh | 0.0 /100 | #302 | Tragic 1.6% |
| Swiss | 0.0 /100 | #303 | Tragic 1.6% |
| Seminole | 0.0 /100 | #304 | Tragic 1.6% |
| Blackfeet | 0.0 /100 | #305 | Tragic 1.6% |
| Creek | 0.0 /100 | #306 | Tragic 1.6% |
| Scottish | 0.0 /100 | #307 | Tragic 1.6% |
| Navajo | 0.0 /100 | #308 | Tragic 1.6% |
| Cape Verdeans | 0.0 /100 | #309 | Tragic 1.7% |
| Whites/Caucasians | 0.0 /100 | #310 | Tragic 1.7% |
| English | 0.0 /100 | #311 | Tragic 1.7% |
Demographics Similar to Immigrants from Uruguay by Disability Age Under 5
In terms of disability age under 5, the demographic groups most similar to Immigrants from Uruguay are Sierra Leonean (1.2%, a difference of 0.010%), Immigrants from Jamaica (1.2%, a difference of 0.020%), Guamanian/Chamorro (1.2%, a difference of 0.11%), Immigrants from Argentina (1.2%, a difference of 0.12%), and Immigrants from Central America (1.2%, a difference of 0.23%).
| Demographics | Rating | Rank | Disability Age Under 5 |
| Guatemalans | 63.6 /100 | #162 | Good 1.2% |
| Immigrants | Guatemala | 63.2 /100 | #163 | Good 1.2% |
| Laotians | 62.8 /100 | #164 | Good 1.2% |
| Immigrants | Kuwait | 62.6 /100 | #165 | Good 1.2% |
| Immigrants | Central America | 61.4 /100 | #166 | Good 1.2% |
| Immigrants | Argentina | 60.2 /100 | #167 | Good 1.2% |
| Sierra Leoneans | 59.1 /100 | #168 | Average 1.2% |
| Immigrants | Uruguay | 59.0 /100 | #169 | Average 1.2% |
| Immigrants | Jamaica | 58.8 /100 | #170 | Average 1.2% |
| Guamanians/Chamorros | 57.8 /100 | #171 | Average 1.2% |
| Crow | 51.0 /100 | #172 | Average 1.2% |
| Immigrants | Ireland | 50.3 /100 | #173 | Average 1.2% |
| Immigrants | Latvia | 50.0 /100 | #174 | Average 1.2% |
| Immigrants | Nigeria | 50.0 /100 | #175 | Average 1.2% |
| Immigrants | Kenya | 48.6 /100 | #176 | Average 1.2% |