Seminole vs Immigrants from Uruguay In Labor Force | Age 16-19
COMPARE
Seminole
Immigrants from Uruguay
In Labor Force | Age 16-19
In Labor Force | Age 16-19 Comparison
Seminole
Immigrants from Uruguay
38.1%
IN LABOR FORCE | AGE 16-19
96.7/ 100
METRIC RATING
123rd/ 347
METRIC RANK
34.4%
IN LABOR FORCE | AGE 16-19
0.9/ 100
METRIC RATING
264th/ 347
METRIC RANK
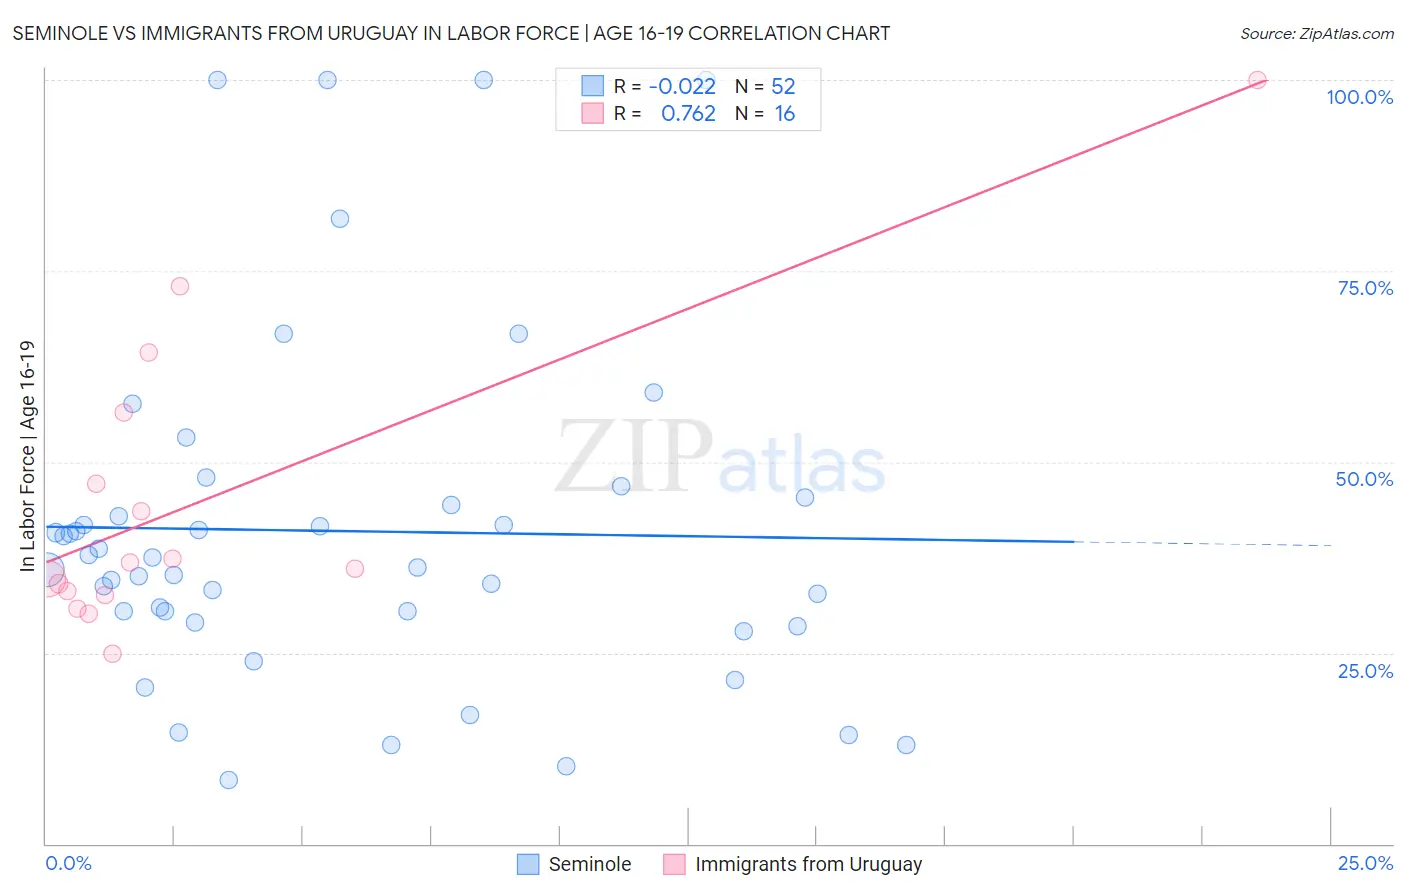
Seminole vs Immigrants from Uruguay In Labor Force | Age 16-19 Correlation Chart
The statistical analysis conducted on geographies consisting of 118,237,632 people shows no correlation between the proportion of Seminole and labor force participation rate among population between the ages 16 and 19 in the United States with a correlation coefficient (R) of -0.022 and weighted average of 38.1%. Similarly, the statistical analysis conducted on geographies consisting of 133,181,589 people shows a strong positive correlation between the proportion of Immigrants from Uruguay and labor force participation rate among population between the ages 16 and 19 in the United States with a correlation coefficient (R) of 0.762 and weighted average of 34.4%, a difference of 10.8%.
In Labor Force | Age 16-19 Correlation Summary
| Measurement | Seminole | Immigrants from Uruguay |
| Minimum | 8.4% | 24.8% |
| Maximum | 100.0% | 100.0% |
| Range | 91.6% | 75.2% |
| Mean | 40.9% | 44.7% |
| Median | 36.8% | 36.4% |
| Interquartile 25% (IQ1) | 29.7% | 32.8% |
| Interquartile 75% (IQ3) | 44.9% | 51.8% |
| Interquartile Range (IQR) | 15.2% | 19.0% |
| Standard Deviation (Sample) | 22.5% | 19.8% |
| Standard Deviation (Population) | 22.3% | 19.2% |
Similar Demographics by In Labor Force | Age 16-19
Demographics Similar to Seminole by In Labor Force | Age 16-19
In terms of in labor force | age 16-19, the demographic groups most similar to Seminole are Immigrants from England (38.1%, a difference of 0.080%), Immigrants from Africa (38.0%, a difference of 0.19%), Guamanian/Chamorro (38.2%, a difference of 0.30%), Ethiopian (38.2%, a difference of 0.32%), and African (38.0%, a difference of 0.34%).
| Demographics | Rating | Rank | In Labor Force | Age 16-19 |
| Colville | 97.9 /100 | #116 | Exceptional 38.3% |
| Chickasaw | 97.8 /100 | #117 | Exceptional 38.3% |
| Immigrants | Nepal | 97.8 /100 | #118 | Exceptional 38.3% |
| Assyrians/Chaldeans/Syriacs | 97.8 /100 | #119 | Exceptional 38.3% |
| Ukrainians | 97.6 /100 | #120 | Exceptional 38.3% |
| Ethiopians | 97.4 /100 | #121 | Exceptional 38.2% |
| Guamanians/Chamorros | 97.4 /100 | #122 | Exceptional 38.2% |
| Seminole | 96.7 /100 | #123 | Exceptional 38.1% |
| Immigrants | England | 96.4 /100 | #124 | Exceptional 38.1% |
| Immigrants | Africa | 96.1 /100 | #125 | Exceptional 38.0% |
| Africans | 95.6 /100 | #126 | Exceptional 38.0% |
| Choctaw | 95.6 /100 | #127 | Exceptional 38.0% |
| New Zealanders | 95.6 /100 | #128 | Exceptional 38.0% |
| Spaniards | 95.5 /100 | #129 | Exceptional 38.0% |
| Immigrants | Zimbabwe | 95.4 /100 | #130 | Exceptional 38.0% |
Demographics Similar to Immigrants from Uruguay by In Labor Force | Age 16-19
In terms of in labor force | age 16-19, the demographic groups most similar to Immigrants from Uruguay are Immigrants from El Salvador (34.3%, a difference of 0.24%), Burmese (34.5%, a difference of 0.28%), Hispanic or Latino (34.5%, a difference of 0.32%), Salvadoran (34.5%, a difference of 0.33%), and Immigrants from Malaysia (34.3%, a difference of 0.33%).
| Demographics | Rating | Rank | In Labor Force | Age 16-19 |
| Immigrants | Egypt | 1.2 /100 | #257 | Tragic 34.6% |
| Thais | 1.2 /100 | #258 | Tragic 34.6% |
| Immigrants | Immigrants | 1.2 /100 | #259 | Tragic 34.6% |
| Egyptians | 1.2 /100 | #260 | Tragic 34.5% |
| Salvadorans | 1.1 /100 | #261 | Tragic 34.5% |
| Hispanics or Latinos | 1.1 /100 | #262 | Tragic 34.5% |
| Burmese | 1.1 /100 | #263 | Tragic 34.5% |
| Immigrants | Uruguay | 0.9 /100 | #264 | Tragic 34.4% |
| Immigrants | El Salvador | 0.7 /100 | #265 | Tragic 34.3% |
| Immigrants | Malaysia | 0.7 /100 | #266 | Tragic 34.3% |
| Immigrants | Peru | 0.5 /100 | #267 | Tragic 34.2% |
| Immigrants | Asia | 0.5 /100 | #268 | Tragic 34.1% |
| Pima | 0.5 /100 | #269 | Tragic 34.1% |
| Immigrants | Russia | 0.4 /100 | #270 | Tragic 34.1% |
| Central American Indians | 0.4 /100 | #271 | Tragic 34.1% |