Seminole vs Immigrants from Uruguay 3rd Grade
COMPARE
Seminole
Immigrants from Uruguay
3rd Grade
3rd Grade Comparison
Seminole
Immigrants from Uruguay
97.9%
3RD GRADE
88.7/ 100
METRIC RATING
134th/ 347
METRIC RANK
97.4%
3RD GRADE
1.7/ 100
METRIC RATING
238th/ 347
METRIC RANK
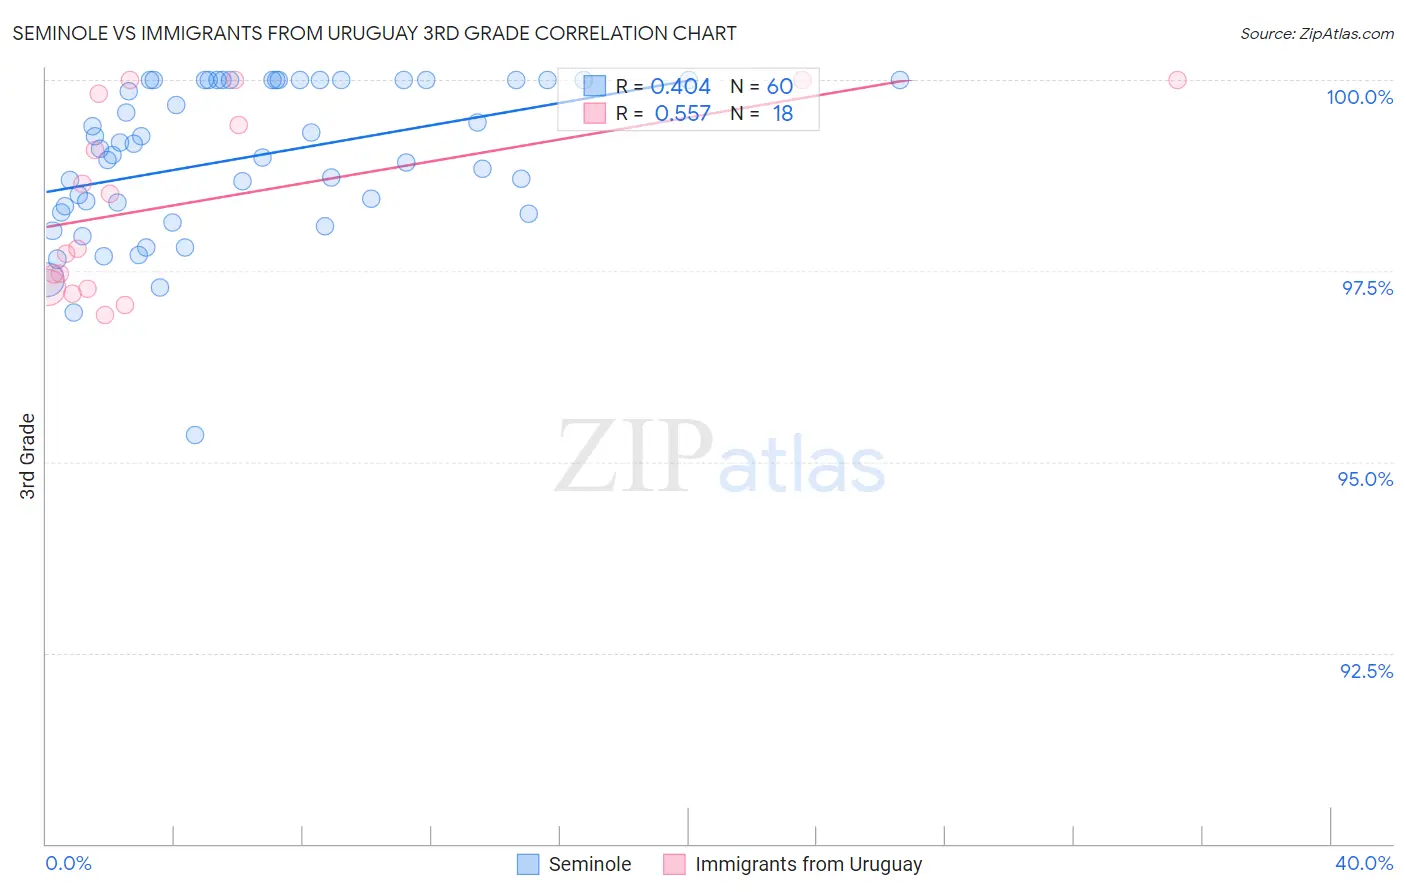
Seminole vs Immigrants from Uruguay 3rd Grade Correlation Chart
The statistical analysis conducted on geographies consisting of 118,313,258 people shows a moderate positive correlation between the proportion of Seminole and percentage of population with at least 3rd grade education in the United States with a correlation coefficient (R) of 0.404 and weighted average of 97.9%. Similarly, the statistical analysis conducted on geographies consisting of 133,259,667 people shows a substantial positive correlation between the proportion of Immigrants from Uruguay and percentage of population with at least 3rd grade education in the United States with a correlation coefficient (R) of 0.557 and weighted average of 97.4%, a difference of 0.52%.
3rd Grade Correlation Summary
| Measurement | Seminole | Immigrants from Uruguay |
| Minimum | 95.3% | 96.9% |
| Maximum | 100.0% | 100.0% |
| Range | 4.7% | 3.1% |
| Mean | 99.0% | 98.4% |
| Median | 99.1% | 98.1% |
| Interquartile 25% (IQ1) | 98.3% | 97.3% |
| Interquartile 75% (IQ3) | 100.0% | 99.8% |
| Interquartile Range (IQR) | 1.7% | 2.5% |
| Standard Deviation (Sample) | 1.0% | 1.2% |
| Standard Deviation (Population) | 1.0% | 1.2% |
Similar Demographics by 3rd Grade
Demographics Similar to Seminole by 3rd Grade
In terms of 3rd grade, the demographic groups most similar to Seminole are Immigrants from Bulgaria (97.9%, a difference of 0.0%), Immigrants from Hungary (97.9%, a difference of 0.0%), Immigrants from Kuwait (97.9%, a difference of 0.0%), Cambodian (97.9%, a difference of 0.0%), and Spaniard (97.9%, a difference of 0.010%).
| Demographics | Rating | Rank | 3rd Grade |
| Ute | 93.2 /100 | #127 | Exceptional 98.0% |
| Colville | 92.1 /100 | #128 | Exceptional 98.0% |
| Immigrants | Serbia | 91.9 /100 | #129 | Exceptional 98.0% |
| Immigrants | Europe | 91.2 /100 | #130 | Exceptional 98.0% |
| Immigrants | Bulgaria | 89.1 /100 | #131 | Excellent 97.9% |
| Immigrants | Hungary | 88.8 /100 | #132 | Excellent 97.9% |
| Immigrants | Kuwait | 88.7 /100 | #133 | Excellent 97.9% |
| Seminole | 88.7 /100 | #134 | Excellent 97.9% |
| Cambodians | 88.1 /100 | #135 | Excellent 97.9% |
| Spaniards | 87.9 /100 | #136 | Excellent 97.9% |
| Immigrants | Romania | 87.9 /100 | #137 | Excellent 97.9% |
| Israelis | 86.6 /100 | #138 | Excellent 97.9% |
| Blackfeet | 86.3 /100 | #139 | Excellent 97.9% |
| Palestinians | 84.6 /100 | #140 | Excellent 97.9% |
| Immigrants | Turkey | 83.5 /100 | #141 | Excellent 97.9% |
Demographics Similar to Immigrants from Uruguay by 3rd Grade
In terms of 3rd grade, the demographic groups most similar to Immigrants from Uruguay are Colombian (97.4%, a difference of 0.0%), Immigrants from Eastern Asia (97.4%, a difference of 0.010%), Immigrants from Iraq (97.4%, a difference of 0.010%), Liberian (97.4%, a difference of 0.010%), and Nigerian (97.4%, a difference of 0.010%).
| Demographics | Rating | Rank | 3rd Grade |
| Immigrants | Costa Rica | 2.7 /100 | #231 | Tragic 97.5% |
| Immigrants | Western Asia | 2.6 /100 | #232 | Tragic 97.5% |
| Immigrants | Malaysia | 2.4 /100 | #233 | Tragic 97.5% |
| Immigrants | Eastern Asia | 1.9 /100 | #234 | Tragic 97.4% |
| Immigrants | Iraq | 1.8 /100 | #235 | Tragic 97.4% |
| Liberians | 1.8 /100 | #236 | Tragic 97.4% |
| Colombians | 1.8 /100 | #237 | Tragic 97.4% |
| Immigrants | Uruguay | 1.7 /100 | #238 | Tragic 97.4% |
| Nigerians | 1.6 /100 | #239 | Tragic 97.4% |
| U.S. Virgin Islanders | 1.4 /100 | #240 | Tragic 97.4% |
| Immigrants | Indonesia | 1.4 /100 | #241 | Tragic 97.4% |
| Koreans | 1.3 /100 | #242 | Tragic 97.4% |
| Indians (Asian) | 1.3 /100 | #243 | Tragic 97.4% |
| Asians | 1.1 /100 | #244 | Tragic 97.4% |
| Ethiopians | 1.1 /100 | #245 | Tragic 97.4% |