Iroquois vs Immigrants from Uruguay Disability Age Under 5
COMPARE
Iroquois
Immigrants from Uruguay
Disability Age Under 5
Disability Age Under 5 Comparison
Iroquois
Immigrants from Uruguay
1.5%
DISABILITY AGE UNDER 5
0.0/ 100
METRIC RATING
274th/ 347
METRIC RANK
1.2%
DISABILITY AGE UNDER 5
59.0/ 100
METRIC RATING
169th/ 347
METRIC RANK
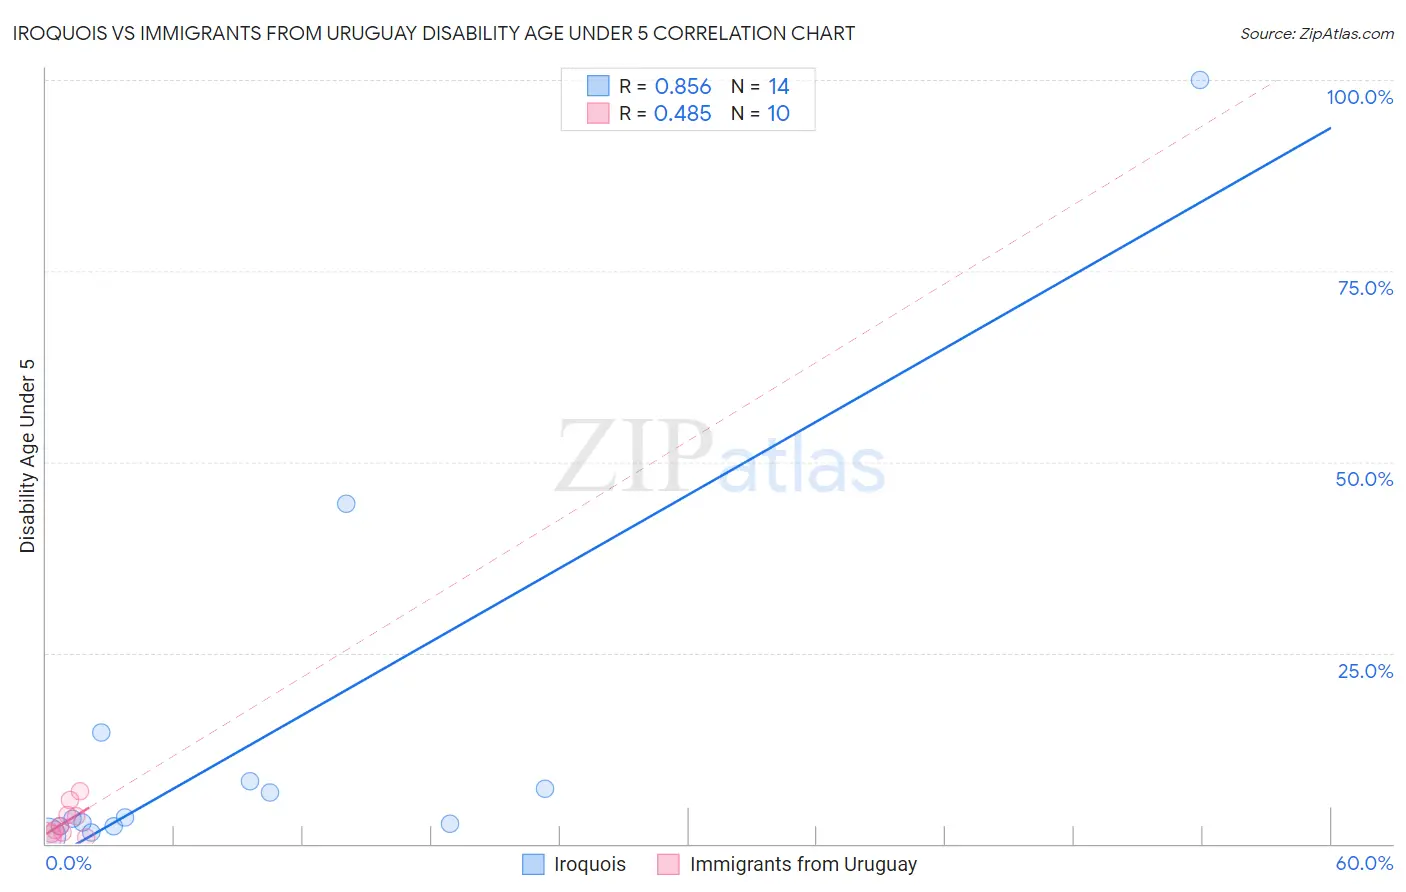
Iroquois vs Immigrants from Uruguay Disability Age Under 5 Correlation Chart
The statistical analysis conducted on geographies consisting of 134,535,381 people shows a very strong positive correlation between the proportion of Iroquois and percentage of population with a disability under the age of 5 in the United States with a correlation coefficient (R) of 0.856 and weighted average of 1.5%. Similarly, the statistical analysis conducted on geographies consisting of 93,497,265 people shows a moderate positive correlation between the proportion of Immigrants from Uruguay and percentage of population with a disability under the age of 5 in the United States with a correlation coefficient (R) of 0.485 and weighted average of 1.2%, a difference of 18.3%.
Disability Age Under 5 Correlation Summary
| Measurement | Iroquois | Immigrants from Uruguay |
| Minimum | 1.0% | 0.84% |
| Maximum | 100.0% | 6.8% |
| Range | 99.0% | 6.0% |
| Mean | 14.3% | 2.8% |
| Median | 3.3% | 2.0% |
| Interquartile 25% (IQ1) | 2.2% | 1.3% |
| Interquartile 75% (IQ3) | 8.2% | 3.8% |
| Interquartile Range (IQR) | 5.9% | 2.5% |
| Standard Deviation (Sample) | 27.1% | 2.1% |
| Standard Deviation (Population) | 26.1% | 2.0% |
Similar Demographics by Disability Age Under 5
Demographics Similar to Iroquois by Disability Age Under 5
In terms of disability age under 5, the demographic groups most similar to Iroquois are Brazilian (1.5%, a difference of 0.11%), Alaskan Athabascan (1.5%, a difference of 0.27%), Black/African American (1.4%, a difference of 0.56%), Greek (1.5%, a difference of 0.69%), and Immigrants from Canada (1.4%, a difference of 0.72%).
| Demographics | Rating | Rank | Disability Age Under 5 |
| Cree | 0.1 /100 | #267 | Tragic 1.4% |
| Belgians | 0.1 /100 | #268 | Tragic 1.4% |
| Austrians | 0.1 /100 | #269 | Tragic 1.4% |
| Immigrants | North America | 0.1 /100 | #270 | Tragic 1.4% |
| Immigrants | Canada | 0.1 /100 | #271 | Tragic 1.4% |
| Blacks/African Americans | 0.1 /100 | #272 | Tragic 1.4% |
| Alaskan Athabascans | 0.1 /100 | #273 | Tragic 1.5% |
| Iroquois | 0.0 /100 | #274 | Tragic 1.5% |
| Brazilians | 0.0 /100 | #275 | Tragic 1.5% |
| Greeks | 0.0 /100 | #276 | Tragic 1.5% |
| Canadians | 0.0 /100 | #277 | Tragic 1.5% |
| Kiowa | 0.0 /100 | #278 | Tragic 1.5% |
| Danes | 0.0 /100 | #279 | Tragic 1.5% |
| British | 0.0 /100 | #280 | Tragic 1.5% |
| Czechoslovakians | 0.0 /100 | #281 | Tragic 1.5% |
Demographics Similar to Immigrants from Uruguay by Disability Age Under 5
In terms of disability age under 5, the demographic groups most similar to Immigrants from Uruguay are Sierra Leonean (1.2%, a difference of 0.010%), Immigrants from Jamaica (1.2%, a difference of 0.020%), Guamanian/Chamorro (1.2%, a difference of 0.11%), Immigrants from Argentina (1.2%, a difference of 0.12%), and Immigrants from Central America (1.2%, a difference of 0.23%).
| Demographics | Rating | Rank | Disability Age Under 5 |
| Guatemalans | 63.6 /100 | #162 | Good 1.2% |
| Immigrants | Guatemala | 63.2 /100 | #163 | Good 1.2% |
| Laotians | 62.8 /100 | #164 | Good 1.2% |
| Immigrants | Kuwait | 62.6 /100 | #165 | Good 1.2% |
| Immigrants | Central America | 61.4 /100 | #166 | Good 1.2% |
| Immigrants | Argentina | 60.2 /100 | #167 | Good 1.2% |
| Sierra Leoneans | 59.1 /100 | #168 | Average 1.2% |
| Immigrants | Uruguay | 59.0 /100 | #169 | Average 1.2% |
| Immigrants | Jamaica | 58.8 /100 | #170 | Average 1.2% |
| Guamanians/Chamorros | 57.8 /100 | #171 | Average 1.2% |
| Crow | 51.0 /100 | #172 | Average 1.2% |
| Immigrants | Ireland | 50.3 /100 | #173 | Average 1.2% |
| Immigrants | Latvia | 50.0 /100 | #174 | Average 1.2% |
| Immigrants | Nigeria | 50.0 /100 | #175 | Average 1.2% |
| Immigrants | Kenya | 48.6 /100 | #176 | Average 1.2% |