Seminole vs Immigrants from Uruguay College, 1 year or more

COMPARE

Seminole
Race
Ancestry
AfghanAfricanAlaska NativeAlaskan AthabascanAlbanianAleutAlsatianAmericanApacheArabArapahoArgentineanArmenianAssyrian/Chaldean/SyriacAustralianAustrianBahamianBangladeshiBarbadianBasqueBelgianBelizeanBermudanBhutaneseBlackfeetBolivianBrazilianBritishBritish West IndianBulgarianBurmeseCajunCambodianCanadianCape VerdeanCarpatho RusynCelticCentral AmericanCentral American IndianCherokeeCheyenneChickasawChileanChineseChippewaChoctawColombianColvilleComancheCosta RicanCreeCreekCroatianCrowCubanCypriotCzechCzechoslovakianDanishDelawareDominicanDutchDutch West IndianEastern EuropeanEcuadorianEgyptianEnglishEstonianEthiopianEuropeanFijianFilipinoFinnishFrenchFrench American IndianFrench CanadianGermanGerman RussianGhanaianGreekGuamanian/ChamorroGuatemalanGuyaneseHaitianHmongHonduranHopiHoumaHungarianIcelanderIndian (Asian)IndonesianInupiatIranianIraqiIrishIroquoisIsraeliItalianJamaicanJapaneseJordanianKenyanKiowaKoreanLaotianLatvianLebaneseLiberianLithuanianLumbeeLuxembourgerMacedonianMalaysianMalteseMarshalleseMenomineeMexicanMexican American IndianMongolianMoroccanNative HawaiianNavajoNepaleseNew ZealanderNicaraguanNigerianNorthern EuropeanNorwegianOkinawanOsageOttawaPaiutePakistaniPalestinianPanamanianParaguayanPennsylvania GermanPeruvianPimaPolishPortuguesePotawatomiPuebloPuerto RicanPuget Sound SalishRomanianRussianSalvadoranSamoanScandinavianScotch-IrishScottishSeminoleSenegaleseSerbianShoshoneSierra LeoneanSiouxSlavicSlovakSloveneSomaliSouth AfricanSouth AmericanSouth American IndianSoviet UnionSpaniardSpanishSpanish AmericanSpanish American IndianSri LankanSubsaharan AfricanSudaneseSwedishSwissSyrianTaiwaneseThaiTlingit-HaidaTohono O'OdhamTonganTrinidadian and TobagonianTsimshianTurkishU.S. Virgin IslanderUgandanUkrainianUruguayanUteVenezuelanVietnameseWelshWest IndianYakamaYaquiYugoslavianYumanYup'ikZimbabwean
Immigration
NonimmigrantsImmigrantsAfghanistanAfricaAlbaniaArgentinaArmeniaAsiaAustraliaAustriaBahamasBangladeshBarbadosBelarusBelgiumBelizeBoliviaBosnia and HerzegovinaBrazilBulgariaBurma/MyanmarCabo VerdeCambodiaCameroonCanadaCaribbeanCentral AmericaChileChinaColombiaCongoCosta RicaCroatiaCubaCzechoslovakiaDenmarkDominicaDominican RepublicEastern AfricaEastern AsiaEastern EuropeEcuadorEgyptEl SalvadorEnglandEritreaEthiopiaEuropeFijiFranceGermanyGhanaGreeceGrenadaGuatemalaGuyanaHaitiHondurasHong KongHungaryIndiaIndonesiaIranIraqIrelandIsraelItalyJamaicaJapanJordanKazakhstanKenyaKoreaKuwaitLaosLatin AmericaLatviaLebanonLiberiaLithuaniaMalaysiaMexicoMicronesiaMiddle AfricaMoldovaMoroccoNepalNetherlandsNicaraguaNigeriaNorth AmericaNorth MacedoniaNorthern AfricaNorthern EuropeNorwayOceaniaPakistanPanamaPeruPhilippinesPolandPortugalRomaniaRussiaSaudi ArabiaScotlandSenegalSerbiaSierra LeoneSingaporeSomaliaSouth AfricaSouth AmericaSouth Central AsiaSouth Eastern AsiaSouthern EuropeSpainSri LankaSt. Vincent and the GrenadinesSudanSwedenSwitzerlandSyriaTaiwanThailandTrinidad and TobagoTurkeyUgandaUkraineUzbekistanVenezuelaVietnamWest IndiesWestern AfricaWestern AsiaWestern EuropeYemenZaireZimbabweAzores
Immigrants from Uruguay
Race
Ancestry
AfghanAfricanAlaska NativeAlaskan AthabascanAlbanianAleutAlsatianAmericanApacheArabArapahoArgentineanArmenianAssyrian/Chaldean/SyriacAustralianAustrianBahamianBangladeshiBarbadianBasqueBelgianBelizeanBermudanBhutaneseBlackfeetBolivianBrazilianBritishBritish West IndianBulgarianBurmeseCajunCambodianCanadianCape VerdeanCarpatho RusynCelticCentral AmericanCentral American IndianCherokeeCheyenneChickasawChileanChineseChippewaChoctawColombianColvilleComancheCosta RicanCreeCreekCroatianCrowCubanCypriotCzechCzechoslovakianDanishDelawareDominicanDutchDutch West IndianEastern EuropeanEcuadorianEgyptianEnglishEstonianEthiopianEuropeanFijianFilipinoFinnishFrenchFrench American IndianFrench CanadianGermanGerman RussianGhanaianGreekGuamanian/ChamorroGuatemalanGuyaneseHaitianHmongHonduranHopiHoumaHungarianIcelanderIndian (Asian)IndonesianInupiatIranianIraqiIrishIroquoisIsraeliItalianJamaicanJapaneseJordanianKenyanKiowaKoreanLaotianLatvianLebaneseLiberianLithuanianLumbeeLuxembourgerMacedonianMalaysianMalteseMarshalleseMenomineeMexicanMexican American IndianMongolianMoroccanNative HawaiianNavajoNepaleseNew ZealanderNicaraguanNigerianNorthern EuropeanNorwegianOkinawanOsageOttawaPaiutePakistaniPalestinianPanamanianParaguayanPennsylvania GermanPeruvianPimaPolishPortuguesePotawatomiPuebloPuerto RicanPuget Sound SalishRomanianRussianSalvadoranSamoanScandinavianScotch-IrishScottishSenegaleseSerbianShoshoneSierra LeoneanSiouxSlavicSlovakSloveneSomaliSouth AfricanSouth AmericanSouth American IndianSoviet UnionSpaniardSpanishSpanish AmericanSpanish American IndianSri LankanSubsaharan AfricanSudaneseSwedishSwissSyrianTaiwaneseThaiTlingit-HaidaTohono O'OdhamTonganTrinidadian and TobagonianTsimshianTurkishU.S. Virgin IslanderUgandanUkrainianUruguayanUteVenezuelanVietnameseWelshWest IndianYakamaYaquiYugoslavianYumanYup'ikZimbabwean
Immigration
NonimmigrantsImmigrantsAfghanistanAfricaAlbaniaArgentinaArmeniaAsiaAustraliaAustriaBahamasBangladeshBarbadosBelarusBelgiumBelizeBoliviaBosnia and HerzegovinaBrazilBulgariaBurma/MyanmarCabo VerdeCambodiaCameroonCanadaCaribbeanCentral AmericaChileChinaColombiaCongoCosta RicaCroatiaCubaCzechoslovakiaDenmarkDominicaDominican RepublicEastern AfricaEastern AsiaEastern EuropeEcuadorEgyptEl SalvadorEnglandEritreaEthiopiaEuropeFijiFranceGermanyGhanaGreeceGrenadaGuatemalaGuyanaHaitiHondurasHong KongHungaryIndiaIndonesiaIranIraqIrelandIsraelItalyJamaicaJapanJordanKazakhstanKenyaKoreaKuwaitLaosLatin AmericaLatviaLebanonLiberiaLithuaniaMalaysiaMexicoMicronesiaMiddle AfricaMoldovaMoroccoNepalNetherlandsNicaraguaNigeriaNorth AmericaNorth MacedoniaNorthern AfricaNorthern EuropeNorwayOceaniaPakistanPanamaPeruPhilippinesPolandPortugalRomaniaRussiaSaudi ArabiaScotlandSenegalSerbiaSierra LeoneSingaporeSomaliaSouth AfricaSouth AmericaSouth Central AsiaSouth Eastern AsiaSouthern EuropeSpainSri LankaSt. Vincent and the GrenadinesSudanSwedenSwitzerlandSyriaTaiwanThailandTrinidad and TobagoTurkeyUgandaUkraineUruguayUzbekistanVenezuelaVietnamWest IndiesWestern AfricaWestern AsiaWestern EuropeYemenZaireZimbabweAzores
College, 1 year or more
Income
Poverty
Unemployment
Labor Participation
Family Structure
Vehicle Availability
Education Level
Disability

College, 1 year or more Comparison

Seminole

Immigrants from Uruguay

Tragic
Poor
52.1%
COLLEGE, 1 YEAR OR MORE
0.0/ 100
METRIC RATING
305th/ 347
METRIC RANK
58.1%
COLLEGE, 1 YEAR OR MORE
15.2/ 100
METRIC RATING
208th/ 347
METRIC RANK

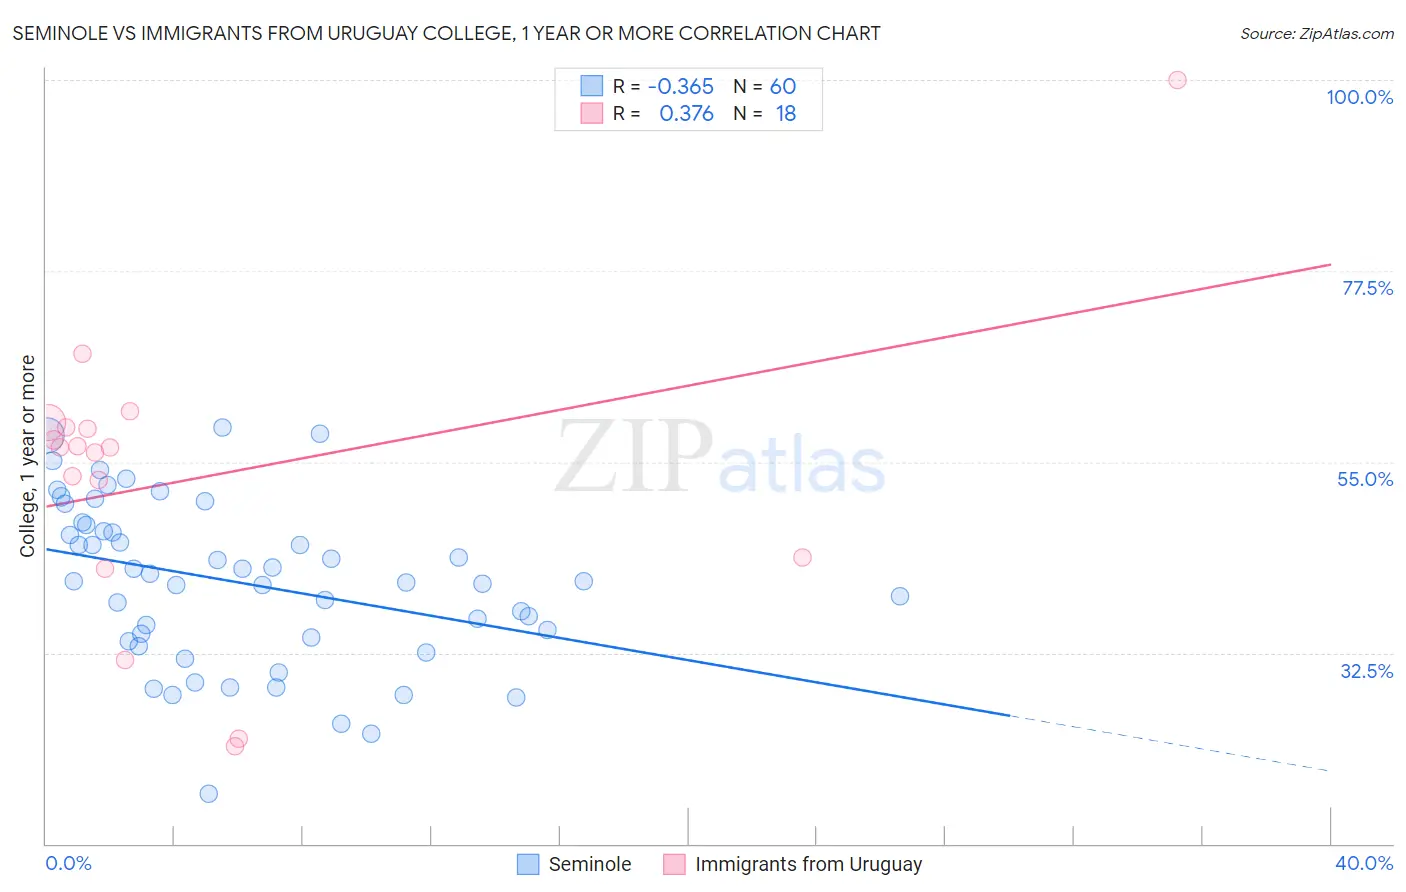
Seminole vs Immigrants from Uruguay College, 1 year or more Correlation Chart

The statistical analysis conducted on geographies consisting of 118,314,121 people shows a mild negative correlation between the proportion of Seminole and percentage of population with at least college, 1 year or more education in the United States with a correlation coefficient (R) of -0.365 and weighted average of 52.1%. Similarly, the statistical analysis conducted on geographies consisting of 133,259,667 people shows a mild positive correlation between the proportion of Immigrants from Uruguay and percentage of population with at least college, 1 year or more education in the United States with a correlation coefficient (R) of 0.376 and weighted average of 58.1%, a difference of 11.5%.
Seminole vs Immigrants from Uruguay College, 1 year or more

College, 1 year or more Correlation Summary

MeasurementSeminoleImmigrants from Uruguay
Minimum15.9%21.5%
Maximum59.0%100.0%
Range43.1%78.5%
Mean40.7%53.2%
Median41.0%56.7%
Interquartile 25% (IQ1)34.1%43.8%
Interquartile 75% (IQ3)47.2%59.1%
Interquartile Range (IQR)13.1%15.3%
Standard Deviation (Sample)9.6%17.6%
Standard Deviation (Population)9.5%17.1%

Similar Demographics by College, 1 year or more

Demographics Similar to Seminole by College, 1 year or more

In terms of college, 1 year or more, the demographic groups most similar to Seminole are Central American (52.1%, a difference of 0.10%), Creek (52.2%, a difference of 0.23%), Puerto Rican (52.2%, a difference of 0.31%), Mexican American Indian (51.9%, a difference of 0.33%), and Haitian (52.3%, a difference of 0.44%).
DemographicsRating | RankCollege, 1 year or more
Immigrants | Dominica
0.0
/100
|
#298
Tragic
52.5%
Immigrants | Nicaragua
0.0
/100
|
#299
Tragic
52.4%
Choctaw
0.0
/100
|
#300
Tragic
52.3%
Haitians
0.0
/100
|
#301
Tragic
52.3%
Puerto Ricans
0.0
/100
|
#302
Tragic
52.2%
Creek
0.0
/100
|
#303
Tragic
52.2%
Central Americans
0.0
/100
|
#304
Tragic
52.1%
Seminole
0.0
/100
|
#305
Tragic
52.1%
Mexican American Indians
0.0
/100
|
#306
Tragic
51.9%
Immigrants | Portugal
0.0
/100
|
#307
Tragic
51.9%
Salvadorans
0.0
/100
|
#308
Tragic
51.8%
Apache
0.0
/100
|
#309
Tragic
51.8%
Hondurans
0.0
/100
|
#310
Tragic
51.6%
Immigrants | Haiti
0.0
/100
|
#311
Tragic
51.5%
Pueblo
0.0
/100
|
#312
Tragic
51.5%

Demographics Similar to Immigrants from Uruguay by College, 1 year or more

In terms of college, 1 year or more, the demographic groups most similar to Immigrants from Uruguay are Immigrants from Middle Africa (58.0%, a difference of 0.13%), Senegalese (58.2%, a difference of 0.17%), Tsimshian (57.9%, a difference of 0.19%), Immigrants from Nigeria (57.9%, a difference of 0.22%), and Immigrants from Vietnam (58.2%, a difference of 0.29%).
DemographicsRating | RankCollege, 1 year or more
Nigerians
23.0
/100
|
#201
Fair
58.5%
Immigrants | South America
21.9
/100
|
#202
Fair
58.4%
Ghanaians
20.9
/100
|
#203
Fair
58.4%
Panamanians
19.2
/100
|
#204
Poor
58.3%
Immigrants | Zaire
18.7
/100
|
#205
Poor
58.3%
Immigrants | Vietnam
18.2
/100
|
#206
Poor
58.2%
Senegalese
16.9
/100
|
#207
Poor
58.2%
Immigrants | Uruguay
15.2
/100
|
#208
Poor
58.1%
Immigrants | Middle Africa
14.0
/100
|
#209
Poor
58.0%
Tsimshian
13.5
/100
|
#210
Poor
57.9%
Immigrants | Nigeria
13.3
/100
|
#211
Poor
57.9%
Immigrants | Senegal
11.8
/100
|
#212
Poor
57.8%
French Canadians
11.8
/100
|
#213
Poor
57.8%
Immigrants | Colombia
11.6
/100
|
#214
Poor
57.8%
Tongans
11.6
/100
|
#215
Poor
57.8%