Immigrants from Netherlands vs Immigrants from Uruguay Disability Age Under 5
COMPARE
Immigrants from Netherlands
Immigrants from Uruguay
Disability Age Under 5
Disability Age Under 5 Comparison
Immigrants from Netherlands
Immigrants from Uruguay
1.4%
DISABILITY AGE UNDER 5
0.2/ 100
METRIC RATING
261st/ 347
METRIC RANK
1.2%
DISABILITY AGE UNDER 5
59.0/ 100
METRIC RATING
169th/ 347
METRIC RANK
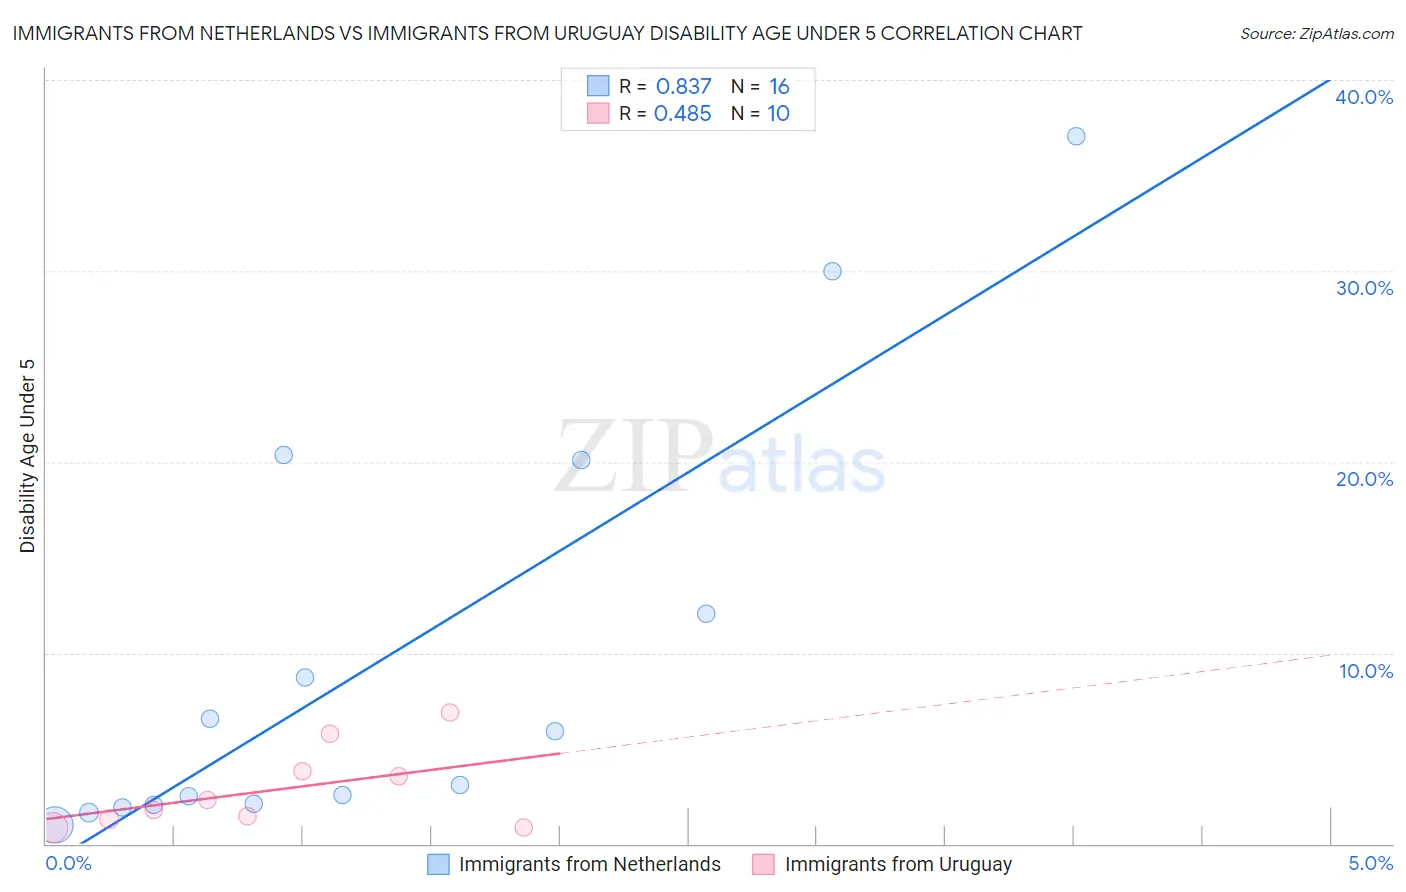
Immigrants from Netherlands vs Immigrants from Uruguay Disability Age Under 5 Correlation Chart
The statistical analysis conducted on geographies consisting of 148,496,878 people shows a very strong positive correlation between the proportion of Immigrants from Netherlands and percentage of population with a disability under the age of 5 in the United States with a correlation coefficient (R) of 0.837 and weighted average of 1.4%. Similarly, the statistical analysis conducted on geographies consisting of 93,497,265 people shows a moderate positive correlation between the proportion of Immigrants from Uruguay and percentage of population with a disability under the age of 5 in the United States with a correlation coefficient (R) of 0.485 and weighted average of 1.2%, a difference of 15.2%.
Disability Age Under 5 Correlation Summary
| Measurement | Immigrants from Netherlands | Immigrants from Uruguay |
| Minimum | 0.96% | 0.84% |
| Maximum | 37.0% | 6.8% |
| Range | 36.1% | 6.0% |
| Mean | 9.8% | 2.8% |
| Median | 4.5% | 2.0% |
| Interquartile 25% (IQ1) | 2.1% | 1.3% |
| Interquartile 75% (IQ3) | 16.1% | 3.8% |
| Interquartile Range (IQR) | 14.0% | 2.5% |
| Standard Deviation (Sample) | 11.2% | 2.1% |
| Standard Deviation (Population) | 10.8% | 2.0% |
Similar Demographics by Disability Age Under 5
Demographics Similar to Immigrants from Netherlands by Disability Age Under 5
In terms of disability age under 5, the demographic groups most similar to Immigrants from Netherlands are Immigrants from Dominica (1.4%, a difference of 0.16%), Spanish (1.4%, a difference of 0.22%), Yugoslavian (1.4%, a difference of 0.37%), Carpatho Rusyn (1.4%, a difference of 0.41%), and Immigrants from Germany (1.4%, a difference of 0.44%).
| Demographics | Rating | Rank | Disability Age Under 5 |
| Immigrants | Brazil | 0.7 /100 | #254 | Tragic 1.4% |
| Immigrants | Liberia | 0.6 /100 | #255 | Tragic 1.4% |
| Immigrants | Western Europe | 0.5 /100 | #256 | Tragic 1.4% |
| Slovenes | 0.3 /100 | #257 | Tragic 1.4% |
| Costa Ricans | 0.3 /100 | #258 | Tragic 1.4% |
| Immigrants | Southern Europe | 0.3 /100 | #259 | Tragic 1.4% |
| Slavs | 0.3 /100 | #260 | Tragic 1.4% |
| Immigrants | Netherlands | 0.2 /100 | #261 | Tragic 1.4% |
| Immigrants | Dominica | 0.2 /100 | #262 | Tragic 1.4% |
| Spanish | 0.2 /100 | #263 | Tragic 1.4% |
| Yugoslavians | 0.1 /100 | #264 | Tragic 1.4% |
| Carpatho Rusyns | 0.1 /100 | #265 | Tragic 1.4% |
| Immigrants | Germany | 0.1 /100 | #266 | Tragic 1.4% |
| Cree | 0.1 /100 | #267 | Tragic 1.4% |
| Belgians | 0.1 /100 | #268 | Tragic 1.4% |
Demographics Similar to Immigrants from Uruguay by Disability Age Under 5
In terms of disability age under 5, the demographic groups most similar to Immigrants from Uruguay are Sierra Leonean (1.2%, a difference of 0.010%), Immigrants from Jamaica (1.2%, a difference of 0.020%), Guamanian/Chamorro (1.2%, a difference of 0.11%), Immigrants from Argentina (1.2%, a difference of 0.12%), and Immigrants from Central America (1.2%, a difference of 0.23%).
| Demographics | Rating | Rank | Disability Age Under 5 |
| Guatemalans | 63.6 /100 | #162 | Good 1.2% |
| Immigrants | Guatemala | 63.2 /100 | #163 | Good 1.2% |
| Laotians | 62.8 /100 | #164 | Good 1.2% |
| Immigrants | Kuwait | 62.6 /100 | #165 | Good 1.2% |
| Immigrants | Central America | 61.4 /100 | #166 | Good 1.2% |
| Immigrants | Argentina | 60.2 /100 | #167 | Good 1.2% |
| Sierra Leoneans | 59.1 /100 | #168 | Average 1.2% |
| Immigrants | Uruguay | 59.0 /100 | #169 | Average 1.2% |
| Immigrants | Jamaica | 58.8 /100 | #170 | Average 1.2% |
| Guamanians/Chamorros | 57.8 /100 | #171 | Average 1.2% |
| Crow | 51.0 /100 | #172 | Average 1.2% |
| Immigrants | Ireland | 50.3 /100 | #173 | Average 1.2% |
| Immigrants | Latvia | 50.0 /100 | #174 | Average 1.2% |
| Immigrants | Nigeria | 50.0 /100 | #175 | Average 1.2% |
| Immigrants | Kenya | 48.6 /100 | #176 | Average 1.2% |