Seminole vs Subsaharan African Disability Age Under 5
COMPARE
Seminole
Subsaharan African
Disability Age Under 5
Disability Age Under 5 Comparison
Seminole
Sub-Saharan Africans
1.6%
DISABILITY AGE UNDER 5
0.0/ 100
METRIC RATING
304th/ 347
METRIC RANK
1.3%
DISABILITY AGE UNDER 5
8.3/ 100
METRIC RATING
221st/ 347
METRIC RANK
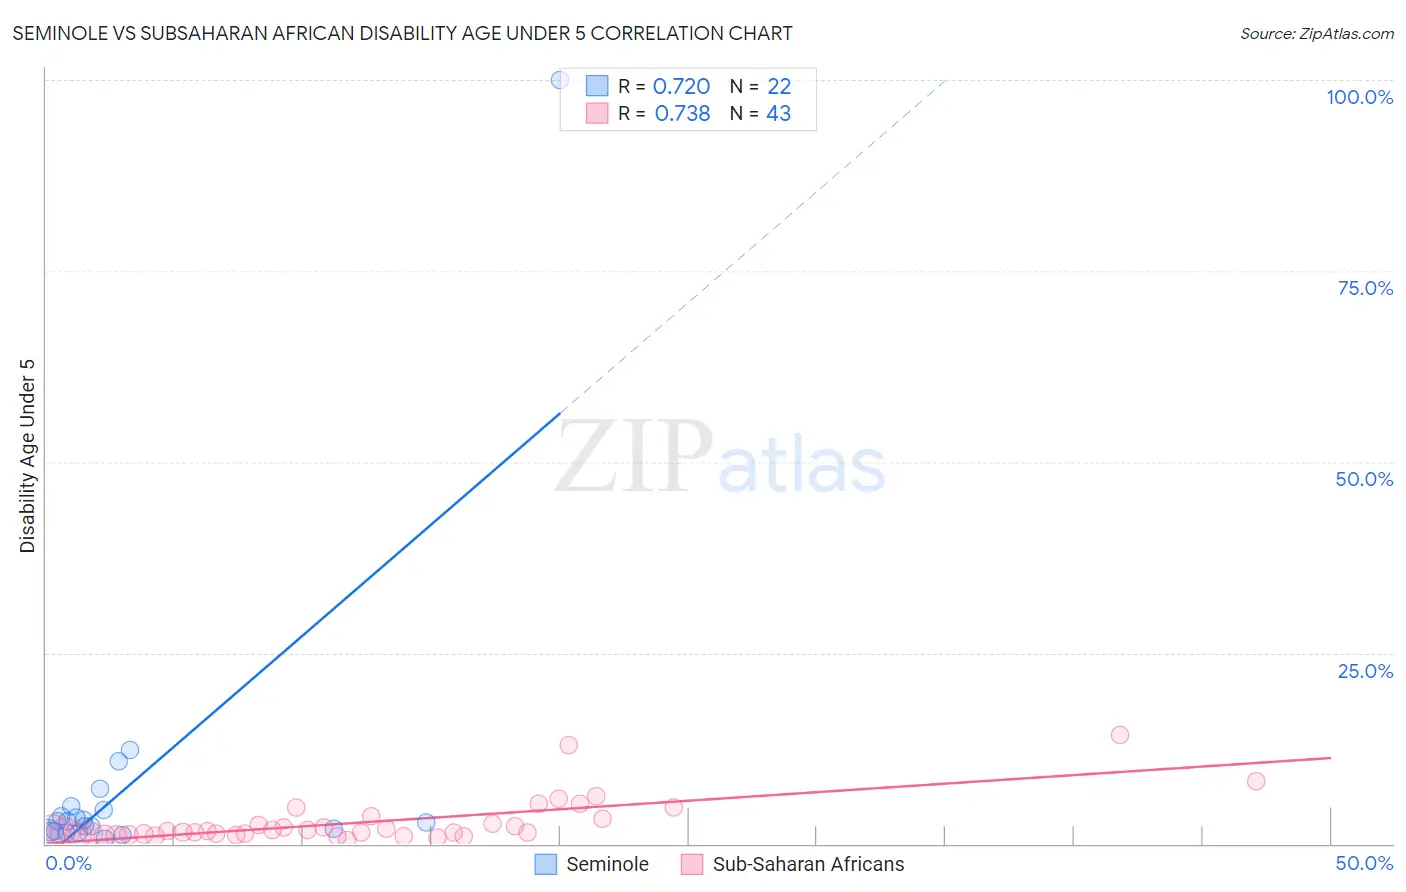
Seminole vs Subsaharan African Disability Age Under 5 Correlation Chart
The statistical analysis conducted on geographies consisting of 90,113,501 people shows a strong positive correlation between the proportion of Seminole and percentage of population with a disability under the age of 5 in the United States with a correlation coefficient (R) of 0.720 and weighted average of 1.6%. Similarly, the statistical analysis conducted on geographies consisting of 252,320,472 people shows a strong positive correlation between the proportion of Sub-Saharan Africans and percentage of population with a disability under the age of 5 in the United States with a correlation coefficient (R) of 0.738 and weighted average of 1.3%, a difference of 25.7%.
Disability Age Under 5 Correlation Summary
| Measurement | Seminole | Subsaharan African |
| Minimum | 0.70% | 0.47% |
| Maximum | 100.0% | 14.3% |
| Range | 99.3% | 13.8% |
| Mean | 7.9% | 2.8% |
| Median | 2.9% | 1.6% |
| Interquartile 25% (IQ1) | 1.6% | 1.2% |
| Interquartile 75% (IQ3) | 4.4% | 3.4% |
| Interquartile Range (IQR) | 2.8% | 2.1% |
| Standard Deviation (Sample) | 20.8% | 3.0% |
| Standard Deviation (Population) | 20.3% | 2.9% |
Similar Demographics by Disability Age Under 5
Demographics Similar to Seminole by Disability Age Under 5
In terms of disability age under 5, the demographic groups most similar to Seminole are Blackfeet (1.6%, a difference of 0.16%), Creek (1.6%, a difference of 0.19%), Scottish (1.6%, a difference of 0.26%), Navajo (1.6%, a difference of 0.40%), and Swiss (1.6%, a difference of 0.63%).
| Demographics | Rating | Rank | Disability Age Under 5 |
| Immigrants | Nonimmigrants | 0.0 /100 | #297 | Tragic 1.6% |
| Cajuns | 0.0 /100 | #298 | Tragic 1.6% |
| Portuguese | 0.0 /100 | #299 | Tragic 1.6% |
| Shoshone | 0.0 /100 | #300 | Tragic 1.6% |
| German Russians | 0.0 /100 | #301 | Tragic 1.6% |
| Welsh | 0.0 /100 | #302 | Tragic 1.6% |
| Swiss | 0.0 /100 | #303 | Tragic 1.6% |
| Seminole | 0.0 /100 | #304 | Tragic 1.6% |
| Blackfeet | 0.0 /100 | #305 | Tragic 1.6% |
| Creek | 0.0 /100 | #306 | Tragic 1.6% |
| Scottish | 0.0 /100 | #307 | Tragic 1.6% |
| Navajo | 0.0 /100 | #308 | Tragic 1.6% |
| Cape Verdeans | 0.0 /100 | #309 | Tragic 1.7% |
| Whites/Caucasians | 0.0 /100 | #310 | Tragic 1.7% |
| English | 0.0 /100 | #311 | Tragic 1.7% |
Demographics Similar to Sub-Saharan Africans by Disability Age Under 5
In terms of disability age under 5, the demographic groups most similar to Sub-Saharan Africans are Ukrainian (1.3%, a difference of 0.0%), Hispanic or Latino (1.3%, a difference of 0.19%), Serbian (1.3%, a difference of 0.34%), Latvian (1.3%, a difference of 0.35%), and Panamanian (1.3%, a difference of 0.38%).
| Demographics | Rating | Rank | Disability Age Under 5 |
| Immigrants | Chile | 17.2 /100 | #214 | Poor 1.3% |
| Syrians | 16.1 /100 | #215 | Poor 1.3% |
| Bangladeshis | 15.5 /100 | #216 | Poor 1.3% |
| Cypriots | 14.9 /100 | #217 | Poor 1.3% |
| Malaysians | 13.2 /100 | #218 | Poor 1.3% |
| Immigrants | Croatia | 11.2 /100 | #219 | Poor 1.3% |
| Serbians | 9.6 /100 | #220 | Tragic 1.3% |
| Sub-Saharan Africans | 8.3 /100 | #221 | Tragic 1.3% |
| Ukrainians | 8.3 /100 | #222 | Tragic 1.3% |
| Hispanics or Latinos | 7.7 /100 | #223 | Tragic 1.3% |
| Latvians | 7.1 /100 | #224 | Tragic 1.3% |
| Panamanians | 7.1 /100 | #225 | Tragic 1.3% |
| Bahamians | 7.1 /100 | #226 | Tragic 1.3% |
| Taiwanese | 6.1 /100 | #227 | Tragic 1.3% |
| Luxembourgers | 6.1 /100 | #228 | Tragic 1.3% |