Seminole vs Immigrants from Vietnam Disability Age Under 5
COMPARE
Seminole
Immigrants from Vietnam
Disability Age Under 5
Disability Age Under 5 Comparison
Seminole
Immigrants from Vietnam
1.6%
DISABILITY AGE UNDER 5
0.0/ 100
METRIC RATING
304th/ 347
METRIC RANK
1.1%
DISABILITY AGE UNDER 5
99.1/ 100
METRIC RATING
63rd/ 347
METRIC RANK
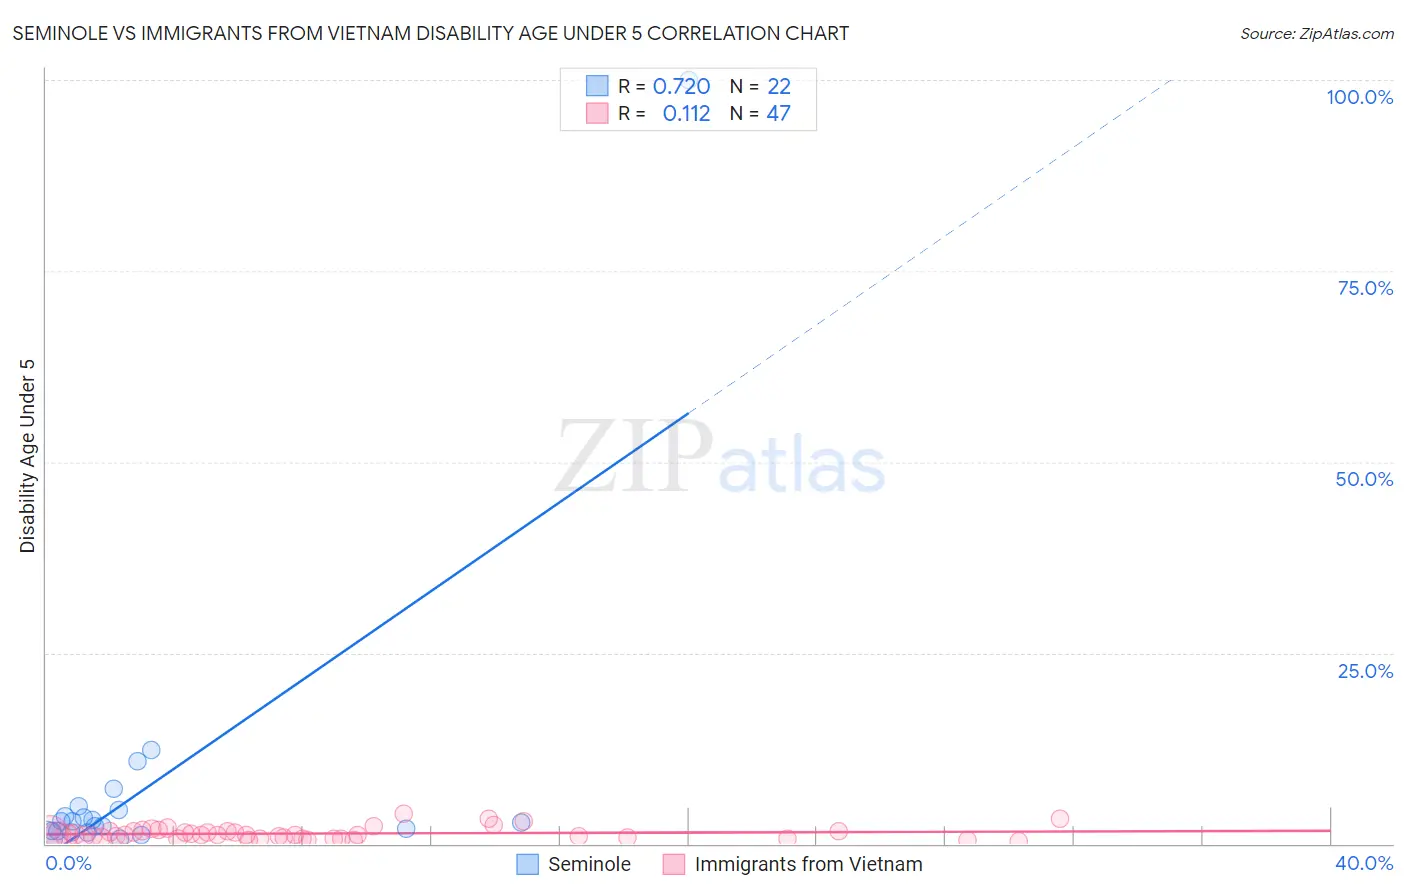
Seminole vs Immigrants from Vietnam Disability Age Under 5 Correlation Chart
The statistical analysis conducted on geographies consisting of 90,113,501 people shows a strong positive correlation between the proportion of Seminole and percentage of population with a disability under the age of 5 in the United States with a correlation coefficient (R) of 0.720 and weighted average of 1.6%. Similarly, the statistical analysis conducted on geographies consisting of 220,992,476 people shows a poor positive correlation between the proportion of Immigrants from Vietnam and percentage of population with a disability under the age of 5 in the United States with a correlation coefficient (R) of 0.112 and weighted average of 1.1%, a difference of 48.3%.
Disability Age Under 5 Correlation Summary
| Measurement | Seminole | Immigrants from Vietnam |
| Minimum | 0.70% | 0.25% |
| Maximum | 100.0% | 4.0% |
| Range | 99.3% | 3.8% |
| Mean | 7.9% | 1.3% |
| Median | 2.9% | 1.1% |
| Interquartile 25% (IQ1) | 1.6% | 0.81% |
| Interquartile 75% (IQ3) | 4.4% | 1.7% |
| Interquartile Range (IQR) | 2.8% | 0.87% |
| Standard Deviation (Sample) | 20.8% | 0.81% |
| Standard Deviation (Population) | 20.3% | 0.80% |
Similar Demographics by Disability Age Under 5
Demographics Similar to Seminole by Disability Age Under 5
In terms of disability age under 5, the demographic groups most similar to Seminole are Blackfeet (1.6%, a difference of 0.16%), Creek (1.6%, a difference of 0.19%), Scottish (1.6%, a difference of 0.26%), Navajo (1.6%, a difference of 0.40%), and Swiss (1.6%, a difference of 0.63%).
| Demographics | Rating | Rank | Disability Age Under 5 |
| Immigrants | Nonimmigrants | 0.0 /100 | #297 | Tragic 1.6% |
| Cajuns | 0.0 /100 | #298 | Tragic 1.6% |
| Portuguese | 0.0 /100 | #299 | Tragic 1.6% |
| Shoshone | 0.0 /100 | #300 | Tragic 1.6% |
| German Russians | 0.0 /100 | #301 | Tragic 1.6% |
| Welsh | 0.0 /100 | #302 | Tragic 1.6% |
| Swiss | 0.0 /100 | #303 | Tragic 1.6% |
| Seminole | 0.0 /100 | #304 | Tragic 1.6% |
| Blackfeet | 0.0 /100 | #305 | Tragic 1.6% |
| Creek | 0.0 /100 | #306 | Tragic 1.6% |
| Scottish | 0.0 /100 | #307 | Tragic 1.6% |
| Navajo | 0.0 /100 | #308 | Tragic 1.6% |
| Cape Verdeans | 0.0 /100 | #309 | Tragic 1.7% |
| Whites/Caucasians | 0.0 /100 | #310 | Tragic 1.7% |
| English | 0.0 /100 | #311 | Tragic 1.7% |
Demographics Similar to Immigrants from Vietnam by Disability Age Under 5
In terms of disability age under 5, the demographic groups most similar to Immigrants from Vietnam are Immigrants from Switzerland (1.1%, a difference of 0.11%), Immigrants from Ethiopia (1.1%, a difference of 0.12%), Immigrants from Western Asia (1.1%, a difference of 0.18%), Egyptian (1.1%, a difference of 0.46%), and Immigrants from Korea (1.1%, a difference of 0.80%).
| Demographics | Rating | Rank | Disability Age Under 5 |
| Ecuadorians | 99.5 /100 | #56 | Exceptional 1.1% |
| Assyrians/Chaldeans/Syriacs | 99.5 /100 | #57 | Exceptional 1.1% |
| Immigrants | Egypt | 99.4 /100 | #58 | Exceptional 1.1% |
| Immigrants | Malaysia | 99.4 /100 | #59 | Exceptional 1.1% |
| Immigrants | Western Asia | 99.2 /100 | #60 | Exceptional 1.1% |
| Immigrants | Ethiopia | 99.2 /100 | #61 | Exceptional 1.1% |
| Immigrants | Switzerland | 99.2 /100 | #62 | Exceptional 1.1% |
| Immigrants | Vietnam | 99.1 /100 | #63 | Exceptional 1.1% |
| Egyptians | 98.9 /100 | #64 | Exceptional 1.1% |
| Immigrants | Korea | 98.8 /100 | #65 | Exceptional 1.1% |
| Immigrants | Indonesia | 98.7 /100 | #66 | Exceptional 1.1% |
| Immigrants | Belize | 98.7 /100 | #67 | Exceptional 1.1% |
| South Africans | 98.7 /100 | #68 | Exceptional 1.1% |
| Israelis | 98.7 /100 | #69 | Exceptional 1.1% |
| Immigrants | Ecuador | 98.6 /100 | #70 | Exceptional 1.1% |