Seminole vs Immigrants from Eastern Asia Disability Age Under 5
COMPARE
Seminole
Immigrants from Eastern Asia
Disability Age Under 5
Disability Age Under 5 Comparison
Seminole
Immigrants from Eastern Asia
1.6%
DISABILITY AGE UNDER 5
0.0/ 100
METRIC RATING
304th/ 347
METRIC RANK
1.0%
DISABILITY AGE UNDER 5
100.0/ 100
METRIC RATING
28th/ 347
METRIC RANK
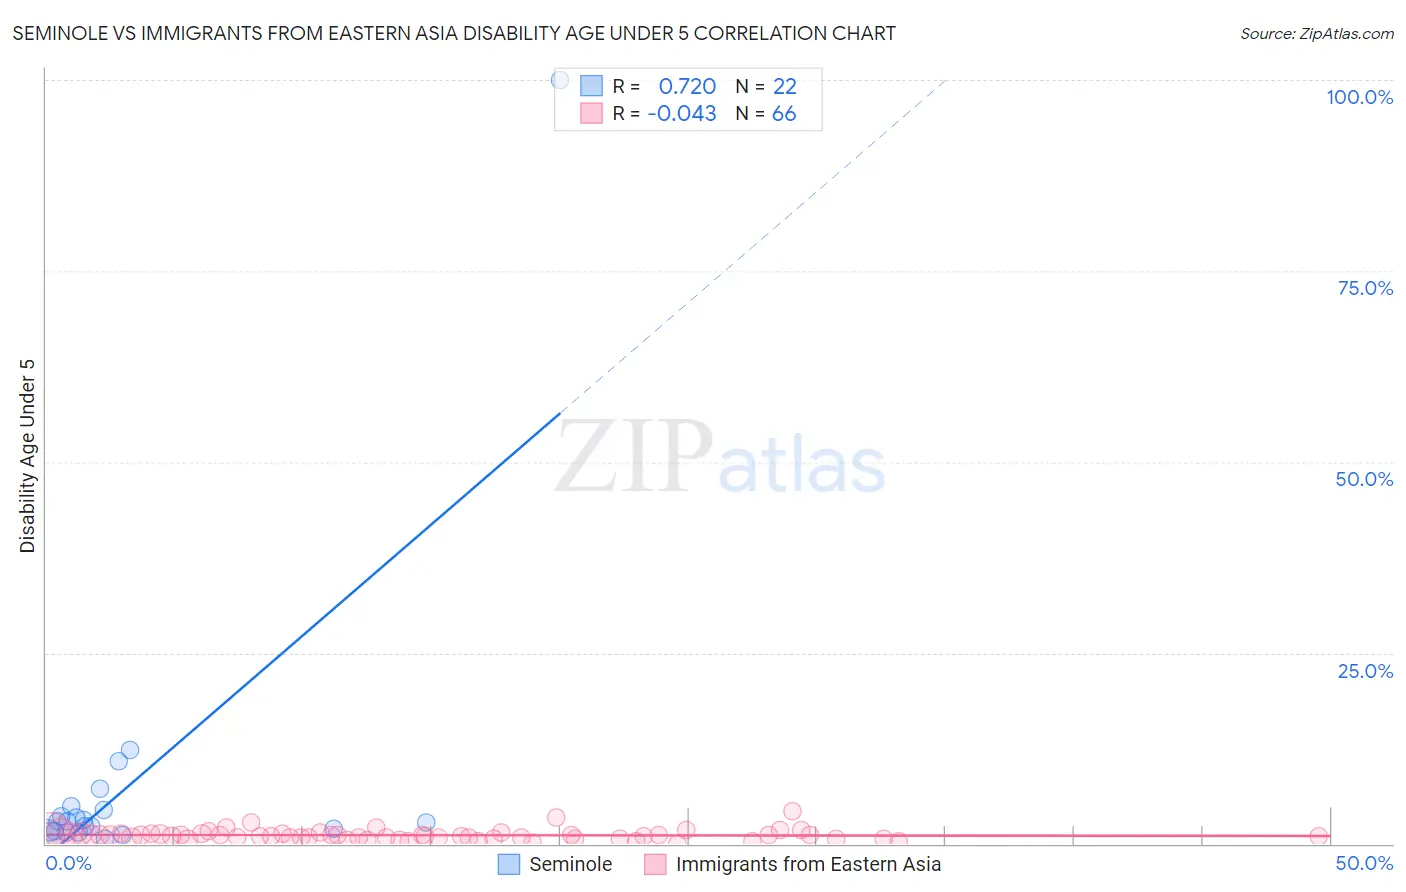
Seminole vs Immigrants from Eastern Asia Disability Age Under 5 Correlation Chart
The statistical analysis conducted on geographies consisting of 90,113,501 people shows a strong positive correlation between the proportion of Seminole and percentage of population with a disability under the age of 5 in the United States with a correlation coefficient (R) of 0.720 and weighted average of 1.6%. Similarly, the statistical analysis conducted on geographies consisting of 247,629,306 people shows no correlation between the proportion of Immigrants from Eastern Asia and percentage of population with a disability under the age of 5 in the United States with a correlation coefficient (R) of -0.043 and weighted average of 1.0%, a difference of 60.8%.
Disability Age Under 5 Correlation Summary
| Measurement | Seminole | Immigrants from Eastern Asia |
| Minimum | 0.70% | 0.058% |
| Maximum | 100.0% | 4.2% |
| Range | 99.3% | 4.2% |
| Mean | 7.9% | 1.1% |
| Median | 2.9% | 1.1% |
| Interquartile 25% (IQ1) | 1.6% | 0.74% |
| Interquartile 75% (IQ3) | 4.4% | 1.3% |
| Interquartile Range (IQR) | 2.8% | 0.54% |
| Standard Deviation (Sample) | 20.8% | 0.69% |
| Standard Deviation (Population) | 20.3% | 0.69% |
Similar Demographics by Disability Age Under 5
Demographics Similar to Seminole by Disability Age Under 5
In terms of disability age under 5, the demographic groups most similar to Seminole are Blackfeet (1.6%, a difference of 0.16%), Creek (1.6%, a difference of 0.19%), Scottish (1.6%, a difference of 0.26%), Navajo (1.6%, a difference of 0.40%), and Swiss (1.6%, a difference of 0.63%).
| Demographics | Rating | Rank | Disability Age Under 5 |
| Immigrants | Nonimmigrants | 0.0 /100 | #297 | Tragic 1.6% |
| Cajuns | 0.0 /100 | #298 | Tragic 1.6% |
| Portuguese | 0.0 /100 | #299 | Tragic 1.6% |
| Shoshone | 0.0 /100 | #300 | Tragic 1.6% |
| German Russians | 0.0 /100 | #301 | Tragic 1.6% |
| Welsh | 0.0 /100 | #302 | Tragic 1.6% |
| Swiss | 0.0 /100 | #303 | Tragic 1.6% |
| Seminole | 0.0 /100 | #304 | Tragic 1.6% |
| Blackfeet | 0.0 /100 | #305 | Tragic 1.6% |
| Creek | 0.0 /100 | #306 | Tragic 1.6% |
| Scottish | 0.0 /100 | #307 | Tragic 1.6% |
| Navajo | 0.0 /100 | #308 | Tragic 1.6% |
| Cape Verdeans | 0.0 /100 | #309 | Tragic 1.7% |
| Whites/Caucasians | 0.0 /100 | #310 | Tragic 1.7% |
| English | 0.0 /100 | #311 | Tragic 1.7% |
Demographics Similar to Immigrants from Eastern Asia by Disability Age Under 5
In terms of disability age under 5, the demographic groups most similar to Immigrants from Eastern Asia are Immigrants from Belarus (1.0%, a difference of 0.12%), Guyanese (1.0%, a difference of 0.63%), Immigrants from South Central Asia (1.0%, a difference of 0.65%), Armenian (1.0%, a difference of 0.93%), and Iranian (1.0%, a difference of 0.98%).
| Demographics | Rating | Rank | Disability Age Under 5 |
| British West Indians | 100.0 /100 | #21 | Exceptional 0.99% |
| Immigrants | Iran | 100.0 /100 | #22 | Exceptional 1.00% |
| Yakama | 100.0 /100 | #23 | Exceptional 1.00% |
| Indians (Asian) | 100.0 /100 | #24 | Exceptional 1.0% |
| Immigrants | Micronesia | 100.0 /100 | #25 | Exceptional 1.0% |
| Immigrants | Taiwan | 100.0 /100 | #26 | Exceptional 1.0% |
| Guyanese | 100.0 /100 | #27 | Exceptional 1.0% |
| Immigrants | Eastern Asia | 100.0 /100 | #28 | Exceptional 1.0% |
| Immigrants | Belarus | 100.0 /100 | #29 | Exceptional 1.0% |
| Immigrants | South Central Asia | 99.9 /100 | #30 | Exceptional 1.0% |
| Armenians | 99.9 /100 | #31 | Exceptional 1.0% |
| Iranians | 99.9 /100 | #32 | Exceptional 1.0% |
| Bolivians | 99.9 /100 | #33 | Exceptional 1.0% |
| Immigrants | Ukraine | 99.9 /100 | #34 | Exceptional 1.0% |
| Barbadians | 99.9 /100 | #35 | Exceptional 1.0% |