Immigrants from Lithuania vs Asian Ambulatory Disability
COMPARE
Immigrants from Lithuania
Asian
Ambulatory Disability
Ambulatory Disability Comparison
Immigrants from Lithuania
Asians
5.6%
AMBULATORY DISABILITY
99.8/ 100
METRIC RATING
60th/ 347
METRIC RANK
5.4%
AMBULATORY DISABILITY
100.0/ 100
METRIC RATING
27th/ 347
METRIC RANK
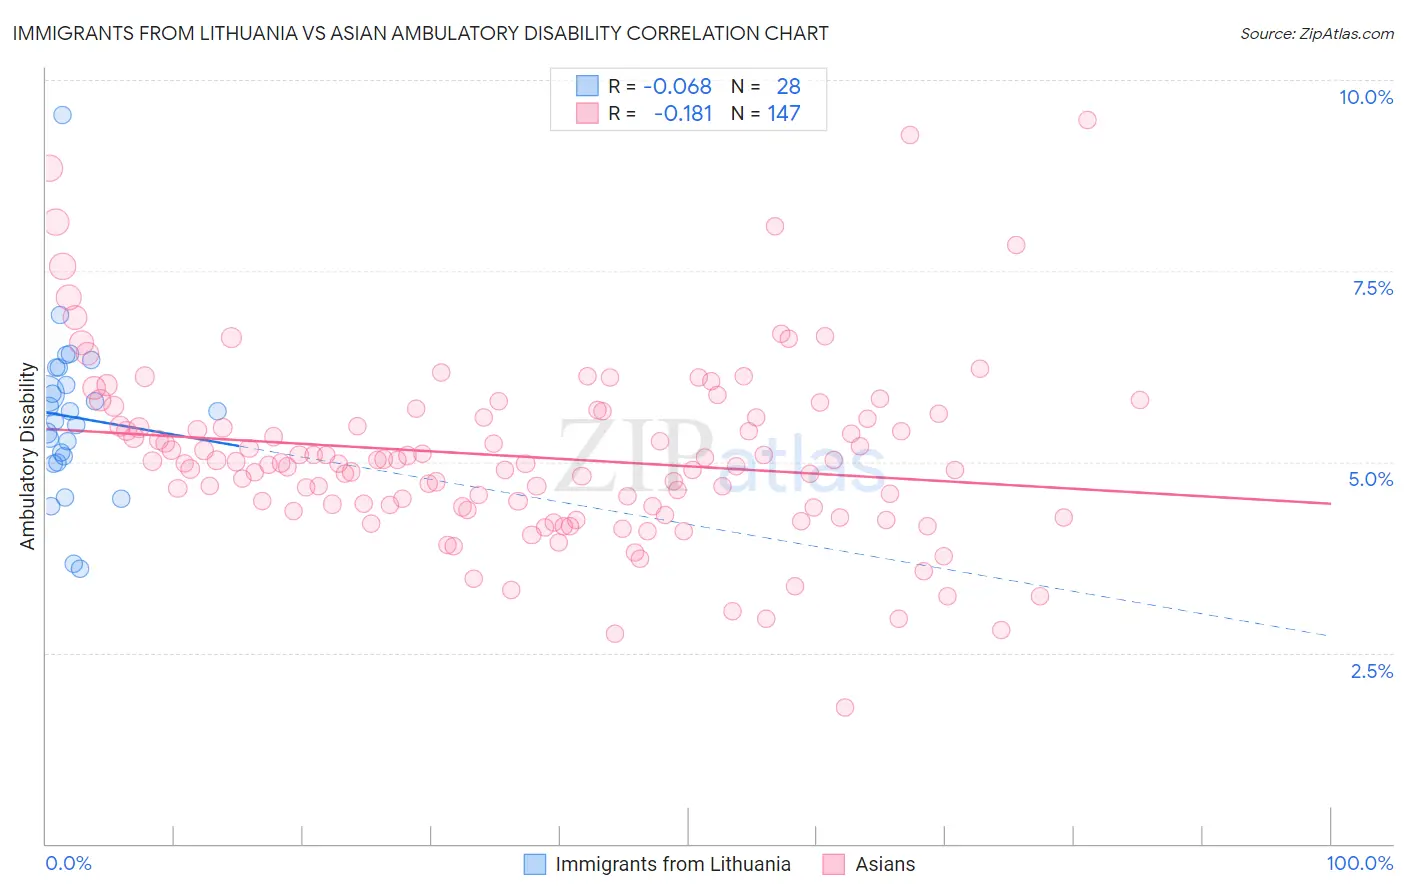
Immigrants from Lithuania vs Asian Ambulatory Disability Correlation Chart
The statistical analysis conducted on geographies consisting of 117,713,012 people shows a slight negative correlation between the proportion of Immigrants from Lithuania and percentage of population with ambulatory disability in the United States with a correlation coefficient (R) of -0.068 and weighted average of 5.6%. Similarly, the statistical analysis conducted on geographies consisting of 550,442,799 people shows a poor negative correlation between the proportion of Asians and percentage of population with ambulatory disability in the United States with a correlation coefficient (R) of -0.181 and weighted average of 5.4%, a difference of 4.2%.
Ambulatory Disability Correlation Summary
| Measurement | Immigrants from Lithuania | Asian |
| Minimum | 3.6% | 1.8% |
| Maximum | 9.5% | 9.5% |
| Range | 5.9% | 7.7% |
| Mean | 5.6% | 5.1% |
| Median | 5.6% | 5.0% |
| Interquartile 25% (IQ1) | 5.0% | 4.4% |
| Interquartile 75% (IQ3) | 6.1% | 5.6% |
| Interquartile Range (IQR) | 1.1% | 1.2% |
| Standard Deviation (Sample) | 1.1% | 1.2% |
| Standard Deviation (Population) | 1.1% | 1.2% |
Similar Demographics by Ambulatory Disability
Demographics Similar to Immigrants from Lithuania by Ambulatory Disability
In terms of ambulatory disability, the demographic groups most similar to Immigrants from Lithuania are Immigrants from Afghanistan (5.6%, a difference of 0.040%), Immigrants from Zimbabwe (5.6%, a difference of 0.080%), Immigrants from Belgium (5.6%, a difference of 0.12%), Immigrants from Spain (5.6%, a difference of 0.13%), and Immigrants from Brazil (5.6%, a difference of 0.14%).
| Demographics | Rating | Rank | Ambulatory Disability |
| Immigrants | Egypt | 99.8 /100 | #53 | Exceptional 5.6% |
| Immigrants | Eastern Africa | 99.8 /100 | #54 | Exceptional 5.6% |
| Immigrants | Bulgaria | 99.8 /100 | #55 | Exceptional 5.6% |
| Inupiat | 99.8 /100 | #56 | Exceptional 5.6% |
| Immigrants | Brazil | 99.8 /100 | #57 | Exceptional 5.6% |
| Immigrants | Zimbabwe | 99.8 /100 | #58 | Exceptional 5.6% |
| Immigrants | Afghanistan | 99.8 /100 | #59 | Exceptional 5.6% |
| Immigrants | Lithuania | 99.8 /100 | #60 | Exceptional 5.6% |
| Immigrants | Belgium | 99.7 /100 | #61 | Exceptional 5.6% |
| Immigrants | Spain | 99.7 /100 | #62 | Exceptional 5.6% |
| Immigrants | France | 99.7 /100 | #63 | Exceptional 5.6% |
| Laotians | 99.7 /100 | #64 | Exceptional 5.7% |
| Immigrants | Switzerland | 99.7 /100 | #65 | Exceptional 5.7% |
| Israelis | 99.6 /100 | #66 | Exceptional 5.7% |
| Immigrants | Uganda | 99.6 /100 | #67 | Exceptional 5.7% |
Demographics Similar to Asians by Ambulatory Disability
In terms of ambulatory disability, the demographic groups most similar to Asians are Cambodian (5.4%, a difference of 0.060%), Immigrants from Nepal (5.4%, a difference of 0.16%), Immigrants from Iran (5.4%, a difference of 0.16%), Zimbabwean (5.4%, a difference of 0.19%), and Immigrants from Saudi Arabia (5.4%, a difference of 0.27%).
| Demographics | Rating | Rank | Ambulatory Disability |
| Ethiopians | 100.0 /100 | #20 | Exceptional 5.4% |
| Immigrants | Kuwait | 100.0 /100 | #21 | Exceptional 5.4% |
| Immigrants | Israel | 100.0 /100 | #22 | Exceptional 5.4% |
| Tongans | 100.0 /100 | #23 | Exceptional 5.4% |
| Immigrants | Saudi Arabia | 100.0 /100 | #24 | Exceptional 5.4% |
| Zimbabweans | 100.0 /100 | #25 | Exceptional 5.4% |
| Immigrants | Nepal | 100.0 /100 | #26 | Exceptional 5.4% |
| Asians | 100.0 /100 | #27 | Exceptional 5.4% |
| Cambodians | 100.0 /100 | #28 | Exceptional 5.4% |
| Immigrants | Iran | 100.0 /100 | #29 | Exceptional 5.4% |
| Immigrants | Turkey | 100.0 /100 | #30 | Exceptional 5.4% |
| Immigrants | Venezuela | 100.0 /100 | #31 | Exceptional 5.4% |
| Immigrants | Australia | 100.0 /100 | #32 | Exceptional 5.5% |
| Immigrants | Pakistan | 100.0 /100 | #33 | Exceptional 5.5% |
| Immigrants | Asia | 100.0 /100 | #34 | Exceptional 5.5% |