Black/African American vs Asian Ambulatory Disability
COMPARE
Black/African American
Asian
Ambulatory Disability
Ambulatory Disability Comparison
Blacks/African Americans
Asians
7.5%
AMBULATORY DISABILITY
0.0/ 100
METRIC RATING
326th/ 347
METRIC RANK
5.4%
AMBULATORY DISABILITY
100.0/ 100
METRIC RATING
27th/ 347
METRIC RANK
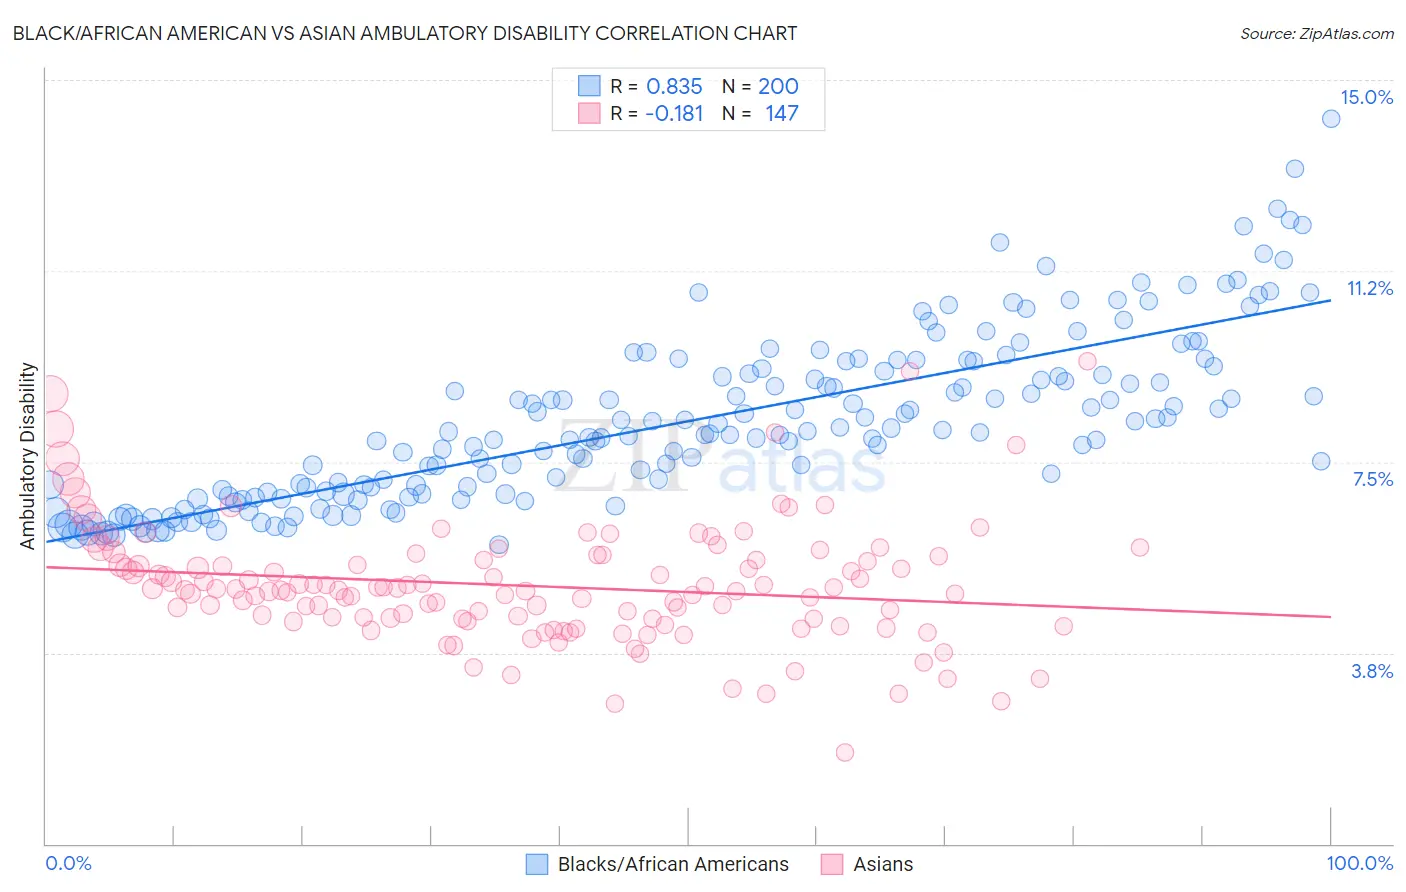
Black/African American vs Asian Ambulatory Disability Correlation Chart
The statistical analysis conducted on geographies consisting of 565,519,006 people shows a very strong positive correlation between the proportion of Blacks/African Americans and percentage of population with ambulatory disability in the United States with a correlation coefficient (R) of 0.835 and weighted average of 7.5%. Similarly, the statistical analysis conducted on geographies consisting of 550,442,799 people shows a poor negative correlation between the proportion of Asians and percentage of population with ambulatory disability in the United States with a correlation coefficient (R) of -0.181 and weighted average of 5.4%, a difference of 39.2%.
Ambulatory Disability Correlation Summary
| Measurement | Black/African American | Asian |
| Minimum | 5.9% | 1.8% |
| Maximum | 14.3% | 9.5% |
| Range | 8.4% | 7.7% |
| Mean | 8.3% | 5.1% |
| Median | 8.1% | 5.0% |
| Interquartile 25% (IQ1) | 6.9% | 4.4% |
| Interquartile 75% (IQ3) | 9.3% | 5.6% |
| Interquartile Range (IQR) | 2.4% | 1.2% |
| Standard Deviation (Sample) | 1.6% | 1.2% |
| Standard Deviation (Population) | 1.6% | 1.2% |
Similar Demographics by Ambulatory Disability
Demographics Similar to Blacks/African Americans by Ambulatory Disability
In terms of ambulatory disability, the demographic groups most similar to Blacks/African Americans are Native/Alaskan (7.5%, a difference of 0.010%), Comanche (7.5%, a difference of 0.11%), Navajo (7.5%, a difference of 0.18%), Hopi (7.6%, a difference of 0.95%), and Pueblo (7.6%, a difference of 0.99%).
| Demographics | Rating | Rank | Ambulatory Disability |
| Dominicans | 0.0 /100 | #319 | Tragic 7.2% |
| Potawatomi | 0.0 /100 | #320 | Tragic 7.3% |
| Apache | 0.0 /100 | #321 | Tragic 7.4% |
| Osage | 0.0 /100 | #322 | Tragic 7.4% |
| Americans | 0.0 /100 | #323 | Tragic 7.4% |
| Navajo | 0.0 /100 | #324 | Tragic 7.5% |
| Comanche | 0.0 /100 | #325 | Tragic 7.5% |
| Blacks/African Americans | 0.0 /100 | #326 | Tragic 7.5% |
| Natives/Alaskans | 0.0 /100 | #327 | Tragic 7.5% |
| Hopi | 0.0 /100 | #328 | Tragic 7.6% |
| Pueblo | 0.0 /100 | #329 | Tragic 7.6% |
| Paiute | 0.0 /100 | #330 | Tragic 7.7% |
| Cajuns | 0.0 /100 | #331 | Tragic 7.8% |
| Menominee | 0.0 /100 | #332 | Tragic 7.8% |
| Cherokee | 0.0 /100 | #333 | Tragic 7.9% |
Demographics Similar to Asians by Ambulatory Disability
In terms of ambulatory disability, the demographic groups most similar to Asians are Cambodian (5.4%, a difference of 0.060%), Immigrants from Nepal (5.4%, a difference of 0.16%), Immigrants from Iran (5.4%, a difference of 0.16%), Zimbabwean (5.4%, a difference of 0.19%), and Immigrants from Saudi Arabia (5.4%, a difference of 0.27%).
| Demographics | Rating | Rank | Ambulatory Disability |
| Ethiopians | 100.0 /100 | #20 | Exceptional 5.4% |
| Immigrants | Kuwait | 100.0 /100 | #21 | Exceptional 5.4% |
| Immigrants | Israel | 100.0 /100 | #22 | Exceptional 5.4% |
| Tongans | 100.0 /100 | #23 | Exceptional 5.4% |
| Immigrants | Saudi Arabia | 100.0 /100 | #24 | Exceptional 5.4% |
| Zimbabweans | 100.0 /100 | #25 | Exceptional 5.4% |
| Immigrants | Nepal | 100.0 /100 | #26 | Exceptional 5.4% |
| Asians | 100.0 /100 | #27 | Exceptional 5.4% |
| Cambodians | 100.0 /100 | #28 | Exceptional 5.4% |
| Immigrants | Iran | 100.0 /100 | #29 | Exceptional 5.4% |
| Immigrants | Turkey | 100.0 /100 | #30 | Exceptional 5.4% |
| Immigrants | Venezuela | 100.0 /100 | #31 | Exceptional 5.4% |
| Immigrants | Australia | 100.0 /100 | #32 | Exceptional 5.5% |
| Immigrants | Pakistan | 100.0 /100 | #33 | Exceptional 5.5% |
| Immigrants | Asia | 100.0 /100 | #34 | Exceptional 5.5% |