Spanish American Indian vs Asian Ambulatory Disability
COMPARE
Spanish American Indian
Asian
Ambulatory Disability
Ambulatory Disability Comparison
Spanish American Indians
Asians
6.5%
AMBULATORY DISABILITY
0.5/ 100
METRIC RATING
258th/ 347
METRIC RANK
5.4%
AMBULATORY DISABILITY
100.0/ 100
METRIC RATING
27th/ 347
METRIC RANK
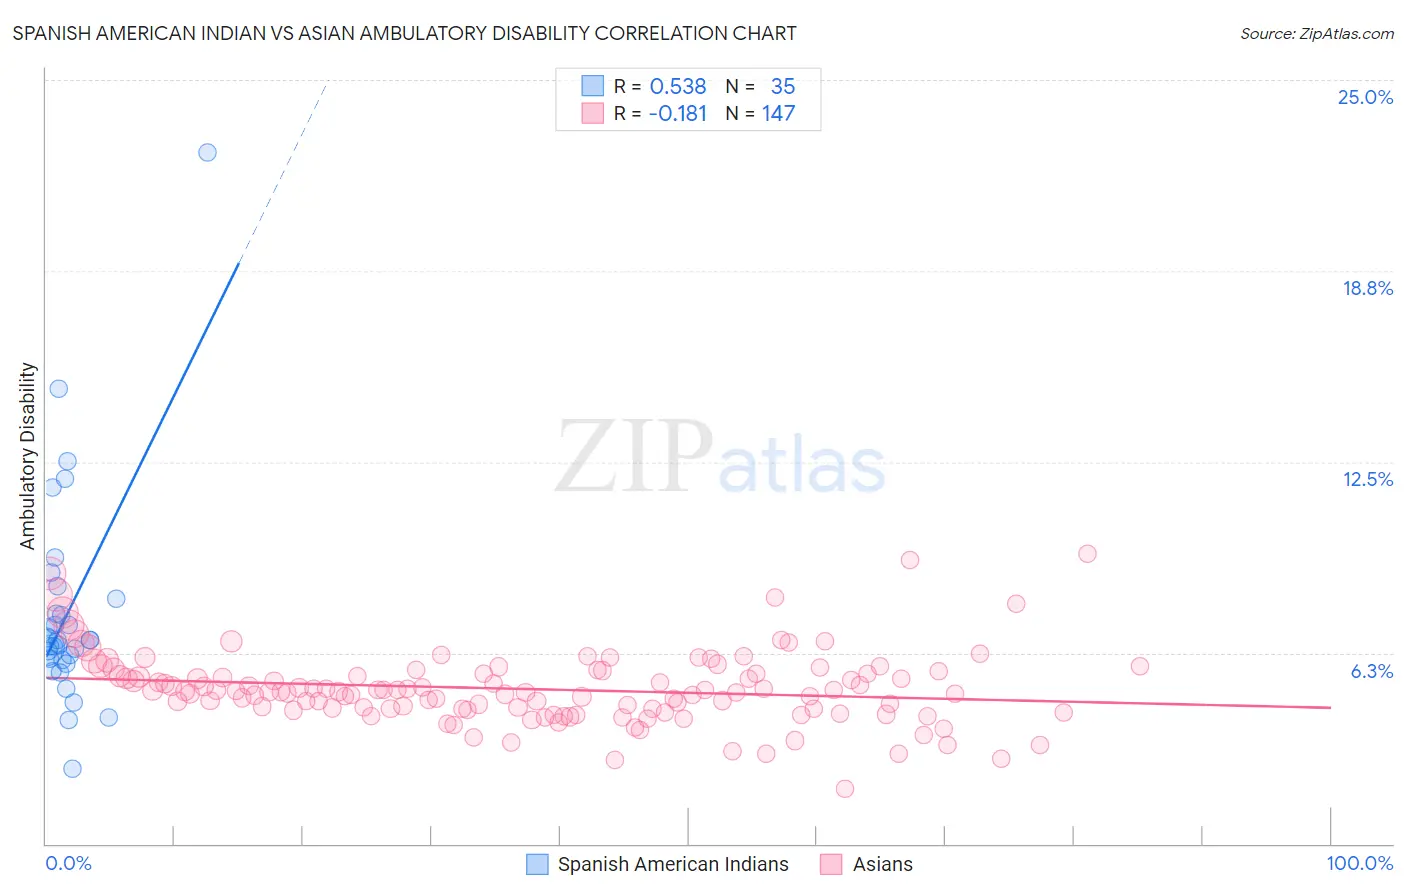
Spanish American Indian vs Asian Ambulatory Disability Correlation Chart
The statistical analysis conducted on geographies consisting of 73,149,525 people shows a substantial positive correlation between the proportion of Spanish American Indians and percentage of population with ambulatory disability in the United States with a correlation coefficient (R) of 0.538 and weighted average of 6.5%. Similarly, the statistical analysis conducted on geographies consisting of 550,442,799 people shows a poor negative correlation between the proportion of Asians and percentage of population with ambulatory disability in the United States with a correlation coefficient (R) of -0.181 and weighted average of 5.4%, a difference of 21.1%.
Ambulatory Disability Correlation Summary
| Measurement | Spanish American Indian | Asian |
| Minimum | 2.4% | 1.8% |
| Maximum | 22.6% | 9.5% |
| Range | 20.2% | 7.7% |
| Mean | 7.6% | 5.1% |
| Median | 6.7% | 5.0% |
| Interquartile 25% (IQ1) | 6.0% | 4.4% |
| Interquartile 75% (IQ3) | 8.0% | 5.6% |
| Interquartile Range (IQR) | 2.0% | 1.2% |
| Standard Deviation (Sample) | 3.6% | 1.2% |
| Standard Deviation (Population) | 3.5% | 1.2% |
Similar Demographics by Ambulatory Disability
Demographics Similar to Spanish American Indians by Ambulatory Disability
In terms of ambulatory disability, the demographic groups most similar to Spanish American Indians are Bermudan (6.5%, a difference of 0.080%), Immigrants from Uzbekistan (6.5%, a difference of 0.16%), Aleut (6.6%, a difference of 0.18%), Immigrants from Belize (6.6%, a difference of 0.19%), and Welsh (6.5%, a difference of 0.23%).
| Demographics | Rating | Rank | Ambulatory Disability |
| Hawaiians | 0.9 /100 | #251 | Tragic 6.5% |
| Immigrants | Bahamas | 0.8 /100 | #252 | Tragic 6.5% |
| Scottish | 0.7 /100 | #253 | Tragic 6.5% |
| Belizeans | 0.7 /100 | #254 | Tragic 6.5% |
| Welsh | 0.6 /100 | #255 | Tragic 6.5% |
| Immigrants | Uzbekistan | 0.6 /100 | #256 | Tragic 6.5% |
| Bermudans | 0.5 /100 | #257 | Tragic 6.5% |
| Spanish American Indians | 0.5 /100 | #258 | Tragic 6.5% |
| Aleuts | 0.4 /100 | #259 | Tragic 6.6% |
| Immigrants | Belize | 0.4 /100 | #260 | Tragic 6.6% |
| Irish | 0.4 /100 | #261 | Tragic 6.6% |
| English | 0.4 /100 | #262 | Tragic 6.6% |
| Hmong | 0.3 /100 | #263 | Tragic 6.6% |
| Nepalese | 0.2 /100 | #264 | Tragic 6.6% |
| Bahamians | 0.2 /100 | #265 | Tragic 6.6% |
Demographics Similar to Asians by Ambulatory Disability
In terms of ambulatory disability, the demographic groups most similar to Asians are Cambodian (5.4%, a difference of 0.060%), Immigrants from Nepal (5.4%, a difference of 0.16%), Immigrants from Iran (5.4%, a difference of 0.16%), Zimbabwean (5.4%, a difference of 0.19%), and Immigrants from Saudi Arabia (5.4%, a difference of 0.27%).
| Demographics | Rating | Rank | Ambulatory Disability |
| Ethiopians | 100.0 /100 | #20 | Exceptional 5.4% |
| Immigrants | Kuwait | 100.0 /100 | #21 | Exceptional 5.4% |
| Immigrants | Israel | 100.0 /100 | #22 | Exceptional 5.4% |
| Tongans | 100.0 /100 | #23 | Exceptional 5.4% |
| Immigrants | Saudi Arabia | 100.0 /100 | #24 | Exceptional 5.4% |
| Zimbabweans | 100.0 /100 | #25 | Exceptional 5.4% |
| Immigrants | Nepal | 100.0 /100 | #26 | Exceptional 5.4% |
| Asians | 100.0 /100 | #27 | Exceptional 5.4% |
| Cambodians | 100.0 /100 | #28 | Exceptional 5.4% |
| Immigrants | Iran | 100.0 /100 | #29 | Exceptional 5.4% |
| Immigrants | Turkey | 100.0 /100 | #30 | Exceptional 5.4% |
| Immigrants | Venezuela | 100.0 /100 | #31 | Exceptional 5.4% |
| Immigrants | Australia | 100.0 /100 | #32 | Exceptional 5.5% |
| Immigrants | Pakistan | 100.0 /100 | #33 | Exceptional 5.5% |
| Immigrants | Asia | 100.0 /100 | #34 | Exceptional 5.5% |