Immigrants from South Central Asia vs Asian Ambulatory Disability
COMPARE
Immigrants from South Central Asia
Asian
Ambulatory Disability
Ambulatory Disability Comparison
Immigrants from South Central Asia
Asians
5.1%
AMBULATORY DISABILITY
100.0/ 100
METRIC RATING
8th/ 347
METRIC RANK
5.4%
AMBULATORY DISABILITY
100.0/ 100
METRIC RATING
27th/ 347
METRIC RANK
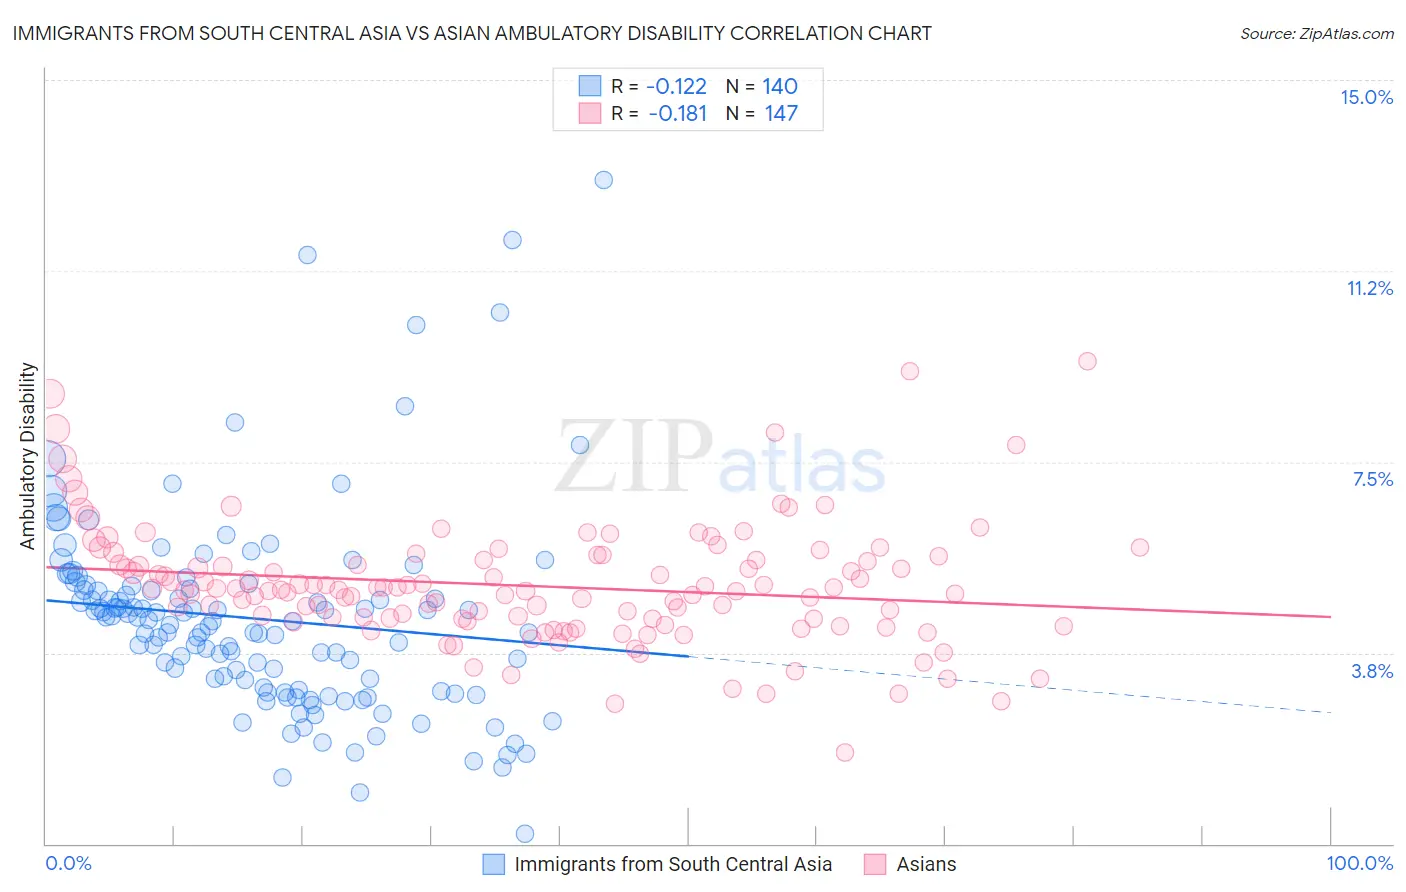
Immigrants from South Central Asia vs Asian Ambulatory Disability Correlation Chart
The statistical analysis conducted on geographies consisting of 472,870,749 people shows a poor negative correlation between the proportion of Immigrants from South Central Asia and percentage of population with ambulatory disability in the United States with a correlation coefficient (R) of -0.122 and weighted average of 5.1%. Similarly, the statistical analysis conducted on geographies consisting of 550,442,799 people shows a poor negative correlation between the proportion of Asians and percentage of population with ambulatory disability in the United States with a correlation coefficient (R) of -0.181 and weighted average of 5.4%, a difference of 5.8%.
Ambulatory Disability Correlation Summary
| Measurement | Immigrants from South Central Asia | Asian |
| Minimum | 0.18% | 1.8% |
| Maximum | 13.0% | 9.5% |
| Range | 12.9% | 7.7% |
| Mean | 4.4% | 5.1% |
| Median | 4.4% | 5.0% |
| Interquartile 25% (IQ1) | 3.0% | 4.4% |
| Interquartile 75% (IQ3) | 5.0% | 5.6% |
| Interquartile Range (IQR) | 2.0% | 1.2% |
| Standard Deviation (Sample) | 2.0% | 1.2% |
| Standard Deviation (Population) | 2.0% | 1.2% |
Demographics Similar to Immigrants from South Central Asia and Asians by Ambulatory Disability
In terms of ambulatory disability, the demographic groups most similar to Immigrants from South Central Asia are Iranian (5.1%, a difference of 0.36%), Yup'ik (5.2%, a difference of 0.97%), Bolivian (5.1%, a difference of 0.99%), Immigrants from Korea (5.2%, a difference of 2.6%), and Okinawan (5.3%, a difference of 2.9%). Similarly, the demographic groups most similar to Asians are Immigrants from Nepal (5.4%, a difference of 0.16%), Zimbabwean (5.4%, a difference of 0.19%), Immigrants from Saudi Arabia (5.4%, a difference of 0.27%), Tongan (5.4%, a difference of 0.36%), and Immigrants from Israel (5.4%, a difference of 0.41%).
| Demographics | Rating | Rank | Ambulatory Disability |
| Bolivians | 100.0 /100 | #7 | Exceptional 5.1% |
| Immigrants | South Central Asia | 100.0 /100 | #8 | Exceptional 5.1% |
| Iranians | 100.0 /100 | #9 | Exceptional 5.1% |
| Yup'ik | 100.0 /100 | #10 | Exceptional 5.2% |
| Immigrants | Korea | 100.0 /100 | #11 | Exceptional 5.2% |
| Okinawans | 100.0 /100 | #12 | Exceptional 5.3% |
| Burmese | 100.0 /100 | #13 | Exceptional 5.3% |
| Immigrants | Eastern Asia | 100.0 /100 | #14 | Exceptional 5.3% |
| Immigrants | China | 100.0 /100 | #15 | Exceptional 5.3% |
| Immigrants | Hong Kong | 100.0 /100 | #16 | Exceptional 5.3% |
| Immigrants | Ethiopia | 100.0 /100 | #17 | Exceptional 5.4% |
| Immigrants | Sri Lanka | 100.0 /100 | #18 | Exceptional 5.4% |
| Indians (Asian) | 100.0 /100 | #19 | Exceptional 5.4% |
| Ethiopians | 100.0 /100 | #20 | Exceptional 5.4% |
| Immigrants | Kuwait | 100.0 /100 | #21 | Exceptional 5.4% |
| Immigrants | Israel | 100.0 /100 | #22 | Exceptional 5.4% |
| Tongans | 100.0 /100 | #23 | Exceptional 5.4% |
| Immigrants | Saudi Arabia | 100.0 /100 | #24 | Exceptional 5.4% |
| Zimbabweans | 100.0 /100 | #25 | Exceptional 5.4% |
| Immigrants | Nepal | 100.0 /100 | #26 | Exceptional 5.4% |
| Asians | 100.0 /100 | #27 | Exceptional 5.4% |