Scottish vs Immigrants from Pakistan Disability Age 5 to 17
COMPARE
Scottish
Immigrants from Pakistan
Disability Age 5 to 17
Disability Age 5 to 17 Comparison
Scottish
Immigrants from Pakistan
6.1%
DISABILITY AGE 5 TO 17
0.0/ 100
METRIC RATING
281st/ 347
METRIC RANK
5.0%
DISABILITY AGE 5 TO 17
100.0/ 100
METRIC RATING
31st/ 347
METRIC RANK
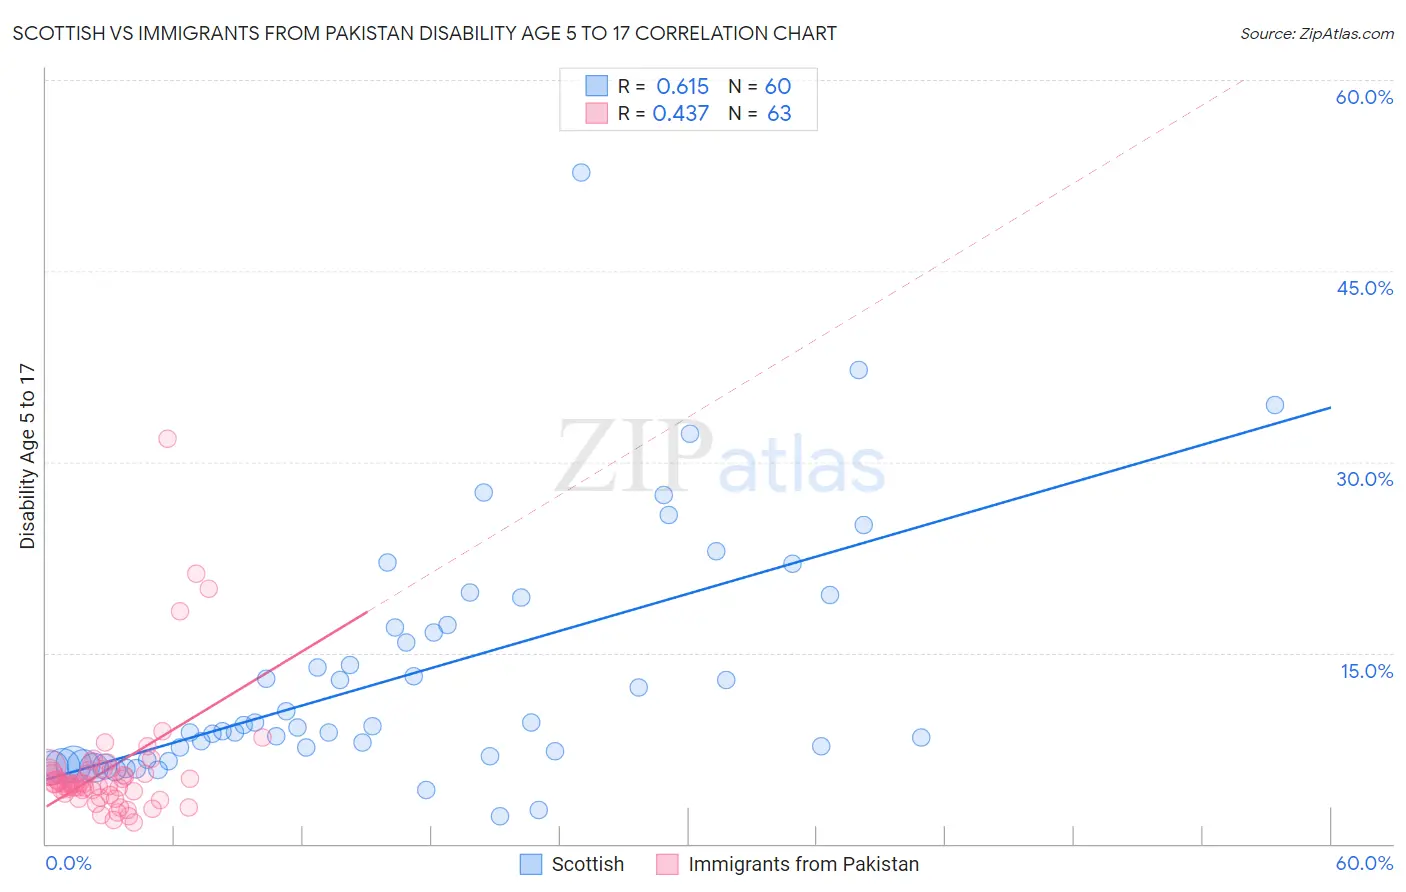
Scottish vs Immigrants from Pakistan Disability Age 5 to 17 Correlation Chart
The statistical analysis conducted on geographies consisting of 553,365,795 people shows a significant positive correlation between the proportion of Scottish and percentage of population with a disability between the ages 5 and 17 in the United States with a correlation coefficient (R) of 0.615 and weighted average of 6.1%. Similarly, the statistical analysis conducted on geographies consisting of 282,773,176 people shows a moderate positive correlation between the proportion of Immigrants from Pakistan and percentage of population with a disability between the ages 5 and 17 in the United States with a correlation coefficient (R) of 0.437 and weighted average of 5.0%, a difference of 23.4%.
Disability Age 5 to 17 Correlation Summary
| Measurement | Scottish | Immigrants from Pakistan |
| Minimum | 2.1% | 1.7% |
| Maximum | 52.7% | 31.8% |
| Range | 50.6% | 30.2% |
| Mean | 13.3% | 5.9% |
| Median | 9.1% | 4.8% |
| Interquartile 25% (IQ1) | 6.8% | 3.9% |
| Interquartile 75% (IQ3) | 17.1% | 5.8% |
| Interquartile Range (IQR) | 10.3% | 1.9% |
| Standard Deviation (Sample) | 9.6% | 4.9% |
| Standard Deviation (Population) | 9.5% | 4.8% |
Similar Demographics by Disability Age 5 to 17
Demographics Similar to Scottish by Disability Age 5 to 17
In terms of disability age 5 to 17, the demographic groups most similar to Scottish are Portuguese (6.1%, a difference of 0.25%), German (6.1%, a difference of 0.25%), Immigrants from Jamaica (6.1%, a difference of 0.39%), Ugandan (6.2%, a difference of 0.41%), and Subsaharan African (6.2%, a difference of 0.44%).
| Demographics | Rating | Rank | Disability Age 5 to 17 |
| Cheyenne | 0.2 /100 | #274 | Tragic 6.0% |
| Dutch | 0.2 /100 | #275 | Tragic 6.0% |
| Japanese | 0.1 /100 | #276 | Tragic 6.1% |
| Puget Sound Salish | 0.1 /100 | #277 | Tragic 6.1% |
| Immigrants | Liberia | 0.1 /100 | #278 | Tragic 6.1% |
| Immigrants | Jamaica | 0.1 /100 | #279 | Tragic 6.1% |
| Portuguese | 0.1 /100 | #280 | Tragic 6.1% |
| Scottish | 0.0 /100 | #281 | Tragic 6.1% |
| Germans | 0.0 /100 | #282 | Tragic 6.1% |
| Ugandans | 0.0 /100 | #283 | Tragic 6.2% |
| Sub-Saharan Africans | 0.0 /100 | #284 | Tragic 6.2% |
| English | 0.0 /100 | #285 | Tragic 6.2% |
| Colville | 0.0 /100 | #286 | Tragic 6.2% |
| Pima | 0.0 /100 | #287 | Tragic 6.2% |
| Jamaicans | 0.0 /100 | #288 | Tragic 6.2% |
Demographics Similar to Immigrants from Pakistan by Disability Age 5 to 17
In terms of disability age 5 to 17, the demographic groups most similar to Immigrants from Pakistan are Soviet Union (5.0%, a difference of 0.040%), Immigrants from Malaysia (5.0%, a difference of 0.25%), Immigrants from Indonesia (5.0%, a difference of 0.36%), Immigrants from Serbia (4.9%, a difference of 0.47%), and Israeli (5.0%, a difference of 0.48%).
| Demographics | Rating | Rank | Disability Age 5 to 17 |
| Immigrants | Lebanon | 100.0 /100 | #24 | Exceptional 4.8% |
| Immigrants | Asia | 100.0 /100 | #25 | Exceptional 4.8% |
| Bhutanese | 100.0 /100 | #26 | Exceptional 4.9% |
| Taiwanese | 100.0 /100 | #27 | Exceptional 4.9% |
| Immigrants | Japan | 100.0 /100 | #28 | Exceptional 4.9% |
| Immigrants | Serbia | 100.0 /100 | #29 | Exceptional 4.9% |
| Immigrants | Malaysia | 100.0 /100 | #30 | Exceptional 5.0% |
| Immigrants | Pakistan | 100.0 /100 | #31 | Exceptional 5.0% |
| Soviet Union | 100.0 /100 | #32 | Exceptional 5.0% |
| Immigrants | Indonesia | 100.0 /100 | #33 | Exceptional 5.0% |
| Israelis | 100.0 /100 | #34 | Exceptional 5.0% |
| Bolivians | 100.0 /100 | #35 | Exceptional 5.0% |
| Immigrants | Egypt | 100.0 /100 | #36 | Exceptional 5.0% |
| Immigrants | Belarus | 100.0 /100 | #37 | Exceptional 5.0% |
| Immigrants | Philippines | 100.0 /100 | #38 | Exceptional 5.0% |