Immigrants from Lithuania vs Immigrants from Jamaica Self-Care Disability
COMPARE
Immigrants from Lithuania
Immigrants from Jamaica
Self-Care Disability
Self-Care Disability Comparison
Immigrants from Lithuania
Immigrants from Jamaica
2.3%
SELF-CARE DISABILITY
99.9/ 100
METRIC RATING
36th/ 347
METRIC RANK
2.7%
SELF-CARE DISABILITY
0.0/ 100
METRIC RATING
287th/ 347
METRIC RANK
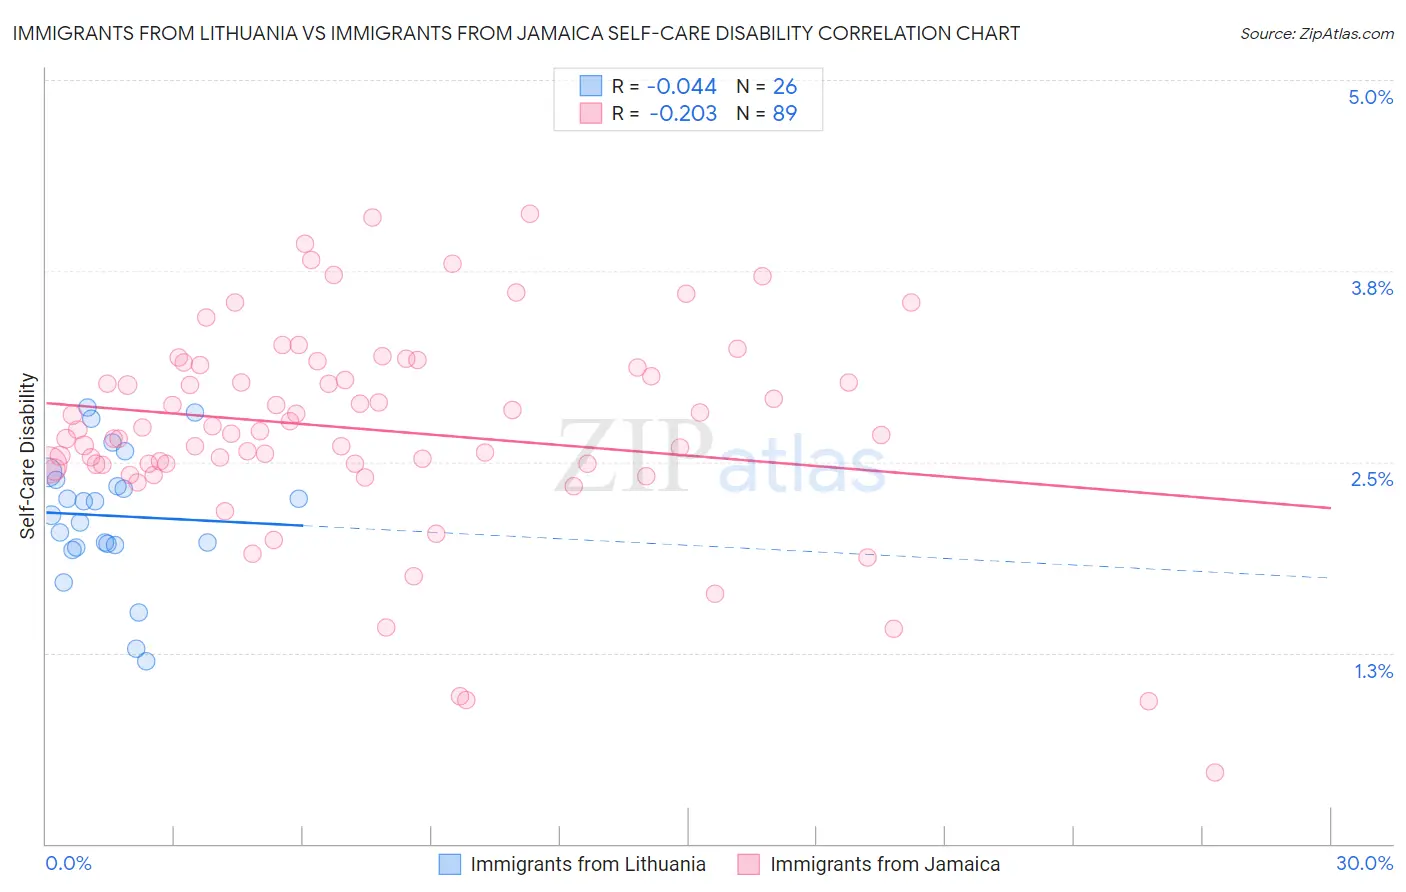
Immigrants from Lithuania vs Immigrants from Jamaica Self-Care Disability Correlation Chart
The statistical analysis conducted on geographies consisting of 117,698,570 people shows no correlation between the proportion of Immigrants from Lithuania and percentage of population with self-care disability in the United States with a correlation coefficient (R) of -0.044 and weighted average of 2.3%. Similarly, the statistical analysis conducted on geographies consisting of 301,430,789 people shows a weak negative correlation between the proportion of Immigrants from Jamaica and percentage of population with self-care disability in the United States with a correlation coefficient (R) of -0.203 and weighted average of 2.7%, a difference of 20.1%.
Self-Care Disability Correlation Summary
| Measurement | Immigrants from Lithuania | Immigrants from Jamaica |
| Minimum | 1.2% | 0.47% |
| Maximum | 2.9% | 4.1% |
| Range | 1.7% | 3.7% |
| Mean | 2.1% | 2.7% |
| Median | 2.2% | 2.7% |
| Interquartile 25% (IQ1) | 2.0% | 2.5% |
| Interquartile 75% (IQ3) | 2.4% | 3.1% |
| Interquartile Range (IQR) | 0.43% | 0.64% |
| Standard Deviation (Sample) | 0.43% | 0.68% |
| Standard Deviation (Population) | 0.42% | 0.68% |
Similar Demographics by Self-Care Disability
Demographics Similar to Immigrants from Lithuania by Self-Care Disability
In terms of self-care disability, the demographic groups most similar to Immigrants from Lithuania are Immigrants from Australia (2.3%, a difference of 0.010%), Immigrants from Turkey (2.3%, a difference of 0.070%), Immigrants from Korea (2.3%, a difference of 0.13%), Immigrants from Sweden (2.3%, a difference of 0.17%), and Immigrants from Eastern Africa (2.3%, a difference of 0.30%).
| Demographics | Rating | Rank | Self-Care Disability |
| Immigrants | Zimbabwe | 99.9 /100 | #29 | Exceptional 2.3% |
| Paraguayans | 99.9 /100 | #30 | Exceptional 2.3% |
| Danes | 99.9 /100 | #31 | Exceptional 2.3% |
| Burmese | 99.9 /100 | #32 | Exceptional 2.3% |
| Immigrants | Korea | 99.9 /100 | #33 | Exceptional 2.3% |
| Immigrants | Turkey | 99.9 /100 | #34 | Exceptional 2.3% |
| Immigrants | Australia | 99.9 /100 | #35 | Exceptional 2.3% |
| Immigrants | Lithuania | 99.9 /100 | #36 | Exceptional 2.3% |
| Immigrants | Sweden | 99.9 /100 | #37 | Exceptional 2.3% |
| Immigrants | Eastern Africa | 99.9 /100 | #38 | Exceptional 2.3% |
| Immigrants | Bulgaria | 99.8 /100 | #39 | Exceptional 2.3% |
| Iranians | 99.8 /100 | #40 | Exceptional 2.3% |
| Immigrants | Sudan | 99.8 /100 | #41 | Exceptional 2.3% |
| Immigrants | Uganda | 99.8 /100 | #42 | Exceptional 2.3% |
| Immigrants | Pakistan | 99.8 /100 | #43 | Exceptional 2.3% |
Demographics Similar to Immigrants from Jamaica by Self-Care Disability
In terms of self-care disability, the demographic groups most similar to Immigrants from Jamaica are Immigrants from Barbados (2.7%, a difference of 0.030%), African (2.7%, a difference of 0.14%), Cuban (2.7%, a difference of 0.29%), French American Indian (2.7%, a difference of 0.33%), and Guyanese (2.7%, a difference of 0.55%).
| Demographics | Rating | Rank | Self-Care Disability |
| Hispanics or Latinos | 0.1 /100 | #280 | Tragic 2.7% |
| Immigrants | Iraq | 0.0 /100 | #281 | Tragic 2.7% |
| Apache | 0.0 /100 | #282 | Tragic 2.7% |
| Delaware | 0.0 /100 | #283 | Tragic 2.7% |
| Fijians | 0.0 /100 | #284 | Tragic 2.7% |
| Jamaicans | 0.0 /100 | #285 | Tragic 2.7% |
| French American Indians | 0.0 /100 | #286 | Tragic 2.7% |
| Immigrants | Jamaica | 0.0 /100 | #287 | Tragic 2.7% |
| Immigrants | Barbados | 0.0 /100 | #288 | Tragic 2.7% |
| Africans | 0.0 /100 | #289 | Tragic 2.7% |
| Cubans | 0.0 /100 | #290 | Tragic 2.7% |
| Guyanese | 0.0 /100 | #291 | Tragic 2.7% |
| Central American Indians | 0.0 /100 | #292 | Tragic 2.7% |
| Belizeans | 0.0 /100 | #293 | Tragic 2.7% |
| Blackfeet | 0.0 /100 | #294 | Tragic 2.7% |