Scotch-Irish vs Immigrants from Jamaica Unemployment
COMPARE
Scotch-Irish
Immigrants from Jamaica
Unemployment
Unemployment Comparison
Scotch-Irish
Immigrants from Jamaica
4.8%
UNEMPLOYMENT
99.8/ 100
METRIC RATING
35th/ 347
METRIC RANK
6.4%
UNEMPLOYMENT
0.0/ 100
METRIC RATING
304th/ 347
METRIC RANK
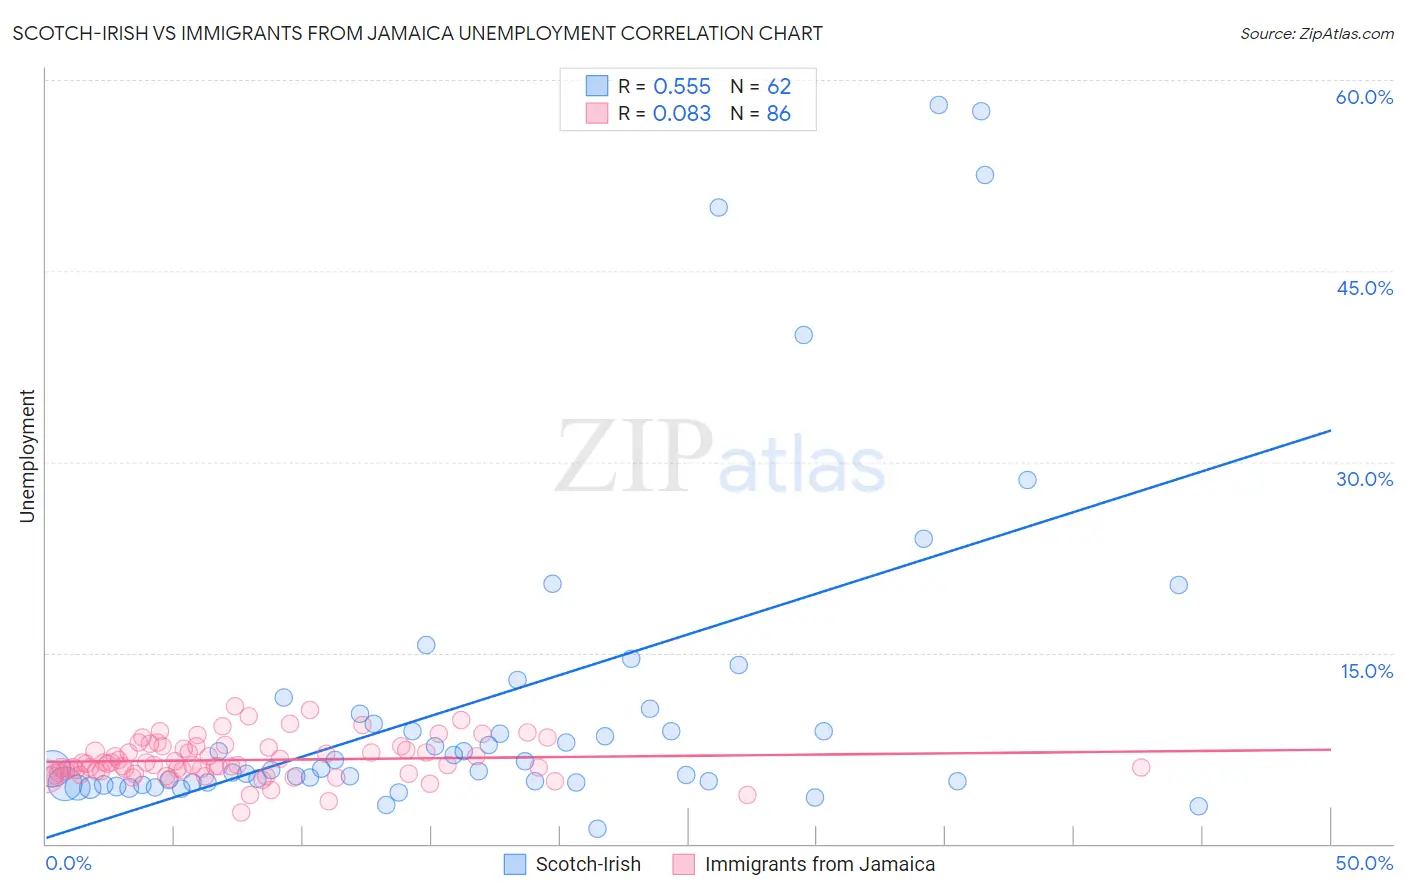
Scotch-Irish vs Immigrants from Jamaica Unemployment Correlation Chart
The statistical analysis conducted on geographies consisting of 545,559,279 people shows a substantial positive correlation between the proportion of Scotch-Irish and unemployment in the United States with a correlation coefficient (R) of 0.555 and weighted average of 4.8%. Similarly, the statistical analysis conducted on geographies consisting of 301,587,568 people shows a slight positive correlation between the proportion of Immigrants from Jamaica and unemployment in the United States with a correlation coefficient (R) of 0.083 and weighted average of 6.4%, a difference of 34.7%.
Unemployment Correlation Summary
| Measurement | Scotch-Irish | Immigrants from Jamaica |
| Minimum | 1.2% | 2.5% |
| Maximum | 58.0% | 10.8% |
| Range | 56.8% | 8.3% |
| Mean | 11.3% | 6.6% |
| Median | 5.9% | 6.2% |
| Interquartile 25% (IQ1) | 4.8% | 5.6% |
| Interquartile 75% (IQ3) | 10.2% | 7.5% |
| Interquartile Range (IQR) | 5.4% | 1.9% |
| Standard Deviation (Sample) | 13.2% | 1.6% |
| Standard Deviation (Population) | 13.1% | 1.6% |
Similar Demographics by Unemployment
Demographics Similar to Scotch-Irish by Unemployment
In terms of unemployment, the demographic groups most similar to Scotch-Irish are Immigrants from Bolivia (4.8%, a difference of 0.070%), Sudanese (4.8%, a difference of 0.11%), Zimbabwean (4.8%, a difference of 0.12%), Croatian (4.8%, a difference of 0.22%), and Tongan (4.8%, a difference of 0.22%).
| Demographics | Rating | Rank | Unemployment |
| Cubans | 99.8 /100 | #28 | Exceptional 4.7% |
| Poles | 99.8 /100 | #29 | Exceptional 4.7% |
| Irish | 99.8 /100 | #30 | Exceptional 4.8% |
| Croatians | 99.8 /100 | #31 | Exceptional 4.8% |
| Zimbabweans | 99.8 /100 | #32 | Exceptional 4.8% |
| Sudanese | 99.8 /100 | #33 | Exceptional 4.8% |
| Immigrants | Bolivia | 99.8 /100 | #34 | Exceptional 4.8% |
| Scotch-Irish | 99.8 /100 | #35 | Exceptional 4.8% |
| Tongans | 99.7 /100 | #36 | Exceptional 4.8% |
| Czechoslovakians | 99.7 /100 | #37 | Exceptional 4.8% |
| Bolivians | 99.7 /100 | #38 | Exceptional 4.8% |
| Lithuanians | 99.7 /100 | #39 | Exceptional 4.8% |
| Northern Europeans | 99.7 /100 | #40 | Exceptional 4.8% |
| Immigrants | Bosnia and Herzegovina | 99.7 /100 | #41 | Exceptional 4.8% |
| Filipinos | 99.5 /100 | #42 | Exceptional 4.8% |
Demographics Similar to Immigrants from Jamaica by Unemployment
In terms of unemployment, the demographic groups most similar to Immigrants from Jamaica are Menominee (6.4%, a difference of 0.25%), Lumbee (6.4%, a difference of 0.29%), Belizean (6.4%, a difference of 0.68%), Immigrants from Bangladesh (6.5%, a difference of 0.77%), and West Indian (6.4%, a difference of 0.91%).
| Demographics | Rating | Rank | Unemployment |
| Jamaicans | 0.0 /100 | #297 | Tragic 6.3% |
| Immigrants | Haiti | 0.0 /100 | #298 | Tragic 6.3% |
| Immigrants | West Indies | 0.0 /100 | #299 | Tragic 6.3% |
| Immigrants | Trinidad and Tobago | 0.0 /100 | #300 | Tragic 6.3% |
| Trinidadians and Tobagonians | 0.0 /100 | #301 | Tragic 6.3% |
| West Indians | 0.0 /100 | #302 | Tragic 6.4% |
| Belizeans | 0.0 /100 | #303 | Tragic 6.4% |
| Immigrants | Jamaica | 0.0 /100 | #304 | Tragic 6.4% |
| Menominee | 0.0 /100 | #305 | Tragic 6.4% |
| Lumbee | 0.0 /100 | #306 | Tragic 6.4% |
| Immigrants | Bangladesh | 0.0 /100 | #307 | Tragic 6.5% |
| Barbadians | 0.0 /100 | #308 | Tragic 6.5% |
| Vietnamese | 0.0 /100 | #309 | Tragic 6.5% |
| Immigrants | Belize | 0.0 /100 | #310 | Tragic 6.5% |
| Cape Verdeans | 0.0 /100 | #311 | Tragic 6.5% |