Scotch-Irish vs Bhutanese Unemployment Among Seniors over 65 years
COMPARE
Scotch-Irish
Bhutanese
Unemployment Among Seniors over 65 years
Unemployment Among Seniors over 65 years Comparison
Scotch-Irish
Bhutanese
4.9%
UNEMPLOYMENT AMONG SENIORS OVER 65 YEARS
99.9/ 100
METRIC RATING
51st/ 347
METRIC RANK
4.8%
UNEMPLOYMENT AMONG SENIORS OVER 65 YEARS
100.0/ 100
METRIC RATING
34th/ 347
METRIC RANK
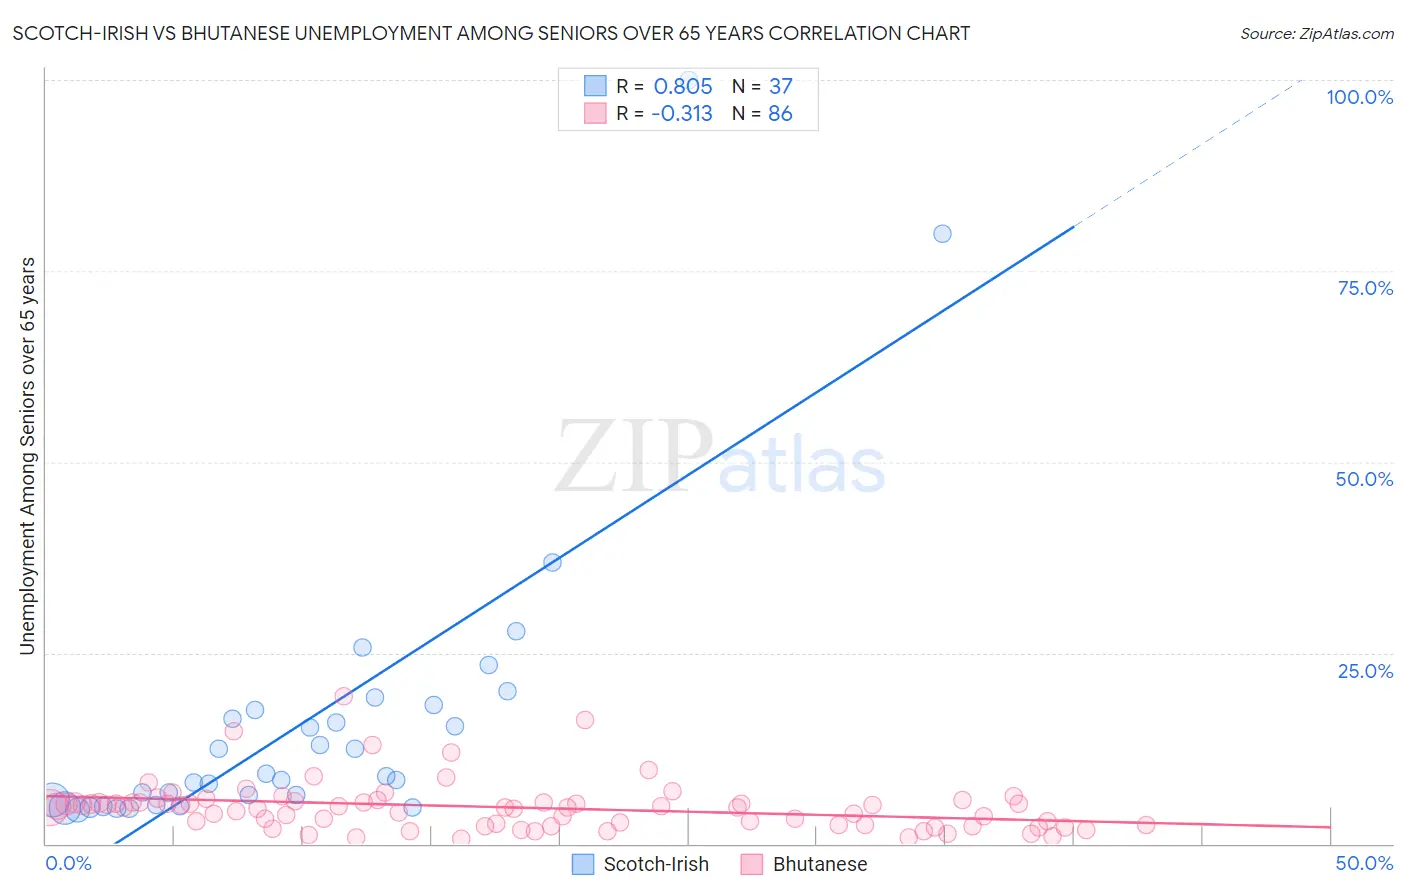
Scotch-Irish vs Bhutanese Unemployment Among Seniors over 65 years Correlation Chart
The statistical analysis conducted on geographies consisting of 447,057,926 people shows a very strong positive correlation between the proportion of Scotch-Irish and unemployment rate amomg seniors over the age of 65 in the United States with a correlation coefficient (R) of 0.805 and weighted average of 4.9%. Similarly, the statistical analysis conducted on geographies consisting of 401,080,570 people shows a mild negative correlation between the proportion of Bhutanese and unemployment rate amomg seniors over the age of 65 in the United States with a correlation coefficient (R) of -0.313 and weighted average of 4.8%, a difference of 1.1%.
Unemployment Among Seniors over 65 years Correlation Summary
| Measurement | Scotch-Irish | Bhutanese |
| Minimum | 4.4% | 0.63% |
| Maximum | 100.0% | 19.2% |
| Range | 95.6% | 18.6% |
| Mean | 16.1% | 4.8% |
| Median | 8.9% | 4.8% |
| Interquartile 25% (IQ1) | 5.4% | 2.4% |
| Interquartile 75% (IQ3) | 17.8% | 5.5% |
| Interquartile Range (IQR) | 12.3% | 3.1% |
| Standard Deviation (Sample) | 19.6% | 3.3% |
| Standard Deviation (Population) | 19.4% | 3.2% |
Demographics Similar to Scotch-Irish and Bhutanese by Unemployment Among Seniors over 65 years
In terms of unemployment among seniors over 65 years, the demographic groups most similar to Scotch-Irish are Swedish (4.9%, a difference of 0.020%), Immigrants from Austria (4.9%, a difference of 0.12%), Immigrants from Kenya (4.9%, a difference of 0.13%), Choctaw (4.9%, a difference of 0.32%), and German (4.9%, a difference of 0.33%). Similarly, the demographic groups most similar to Bhutanese are Immigrants from Kuwait (4.8%, a difference of 0.020%), Cambodian (4.8%, a difference of 0.15%), Bulgarian (4.8%, a difference of 0.17%), Immigrants from India (4.8%, a difference of 0.23%), and Macedonian (4.8%, a difference of 0.26%).
| Demographics | Rating | Rank | Unemployment Among Seniors over 65 years |
| Slovenes | 100.0 /100 | #32 | Exceptional 4.8% |
| Palestinians | 100.0 /100 | #33 | Exceptional 4.8% |
| Bhutanese | 100.0 /100 | #34 | Exceptional 4.8% |
| Immigrants | Kuwait | 100.0 /100 | #35 | Exceptional 4.8% |
| Cambodians | 100.0 /100 | #36 | Exceptional 4.8% |
| Bulgarians | 99.9 /100 | #37 | Exceptional 4.8% |
| Immigrants | India | 99.9 /100 | #38 | Exceptional 4.8% |
| Macedonians | 99.9 /100 | #39 | Exceptional 4.8% |
| Immigrants | Sweden | 99.9 /100 | #40 | Exceptional 4.8% |
| Kiowa | 99.9 /100 | #41 | Exceptional 4.8% |
| Swiss | 99.9 /100 | #42 | Exceptional 4.8% |
| Luxembourgers | 99.9 /100 | #43 | Exceptional 4.8% |
| Jordanians | 99.9 /100 | #44 | Exceptional 4.9% |
| Ethiopians | 99.9 /100 | #45 | Exceptional 4.9% |
| Immigrants | Jordan | 99.9 /100 | #46 | Exceptional 4.9% |
| Germans | 99.9 /100 | #47 | Exceptional 4.9% |
| Choctaw | 99.9 /100 | #48 | Exceptional 4.9% |
| Immigrants | Kenya | 99.9 /100 | #49 | Exceptional 4.9% |
| Immigrants | Austria | 99.9 /100 | #50 | Exceptional 4.9% |
| Scotch-Irish | 99.9 /100 | #51 | Exceptional 4.9% |
| Swedes | 99.9 /100 | #52 | Exceptional 4.9% |