Liberian vs Bhutanese Disability Age 65 to 74
COMPARE
Liberian
Bhutanese
Disability Age 65 to 74
Disability Age 65 to 74 Comparison
Liberians
Bhutanese
25.6%
DISABILITY AGE 65 TO 74
0.1/ 100
METRIC RATING
268th/ 347
METRIC RANK
21.5%
DISABILITY AGE 65 TO 74
99.6/ 100
METRIC RATING
53rd/ 347
METRIC RANK
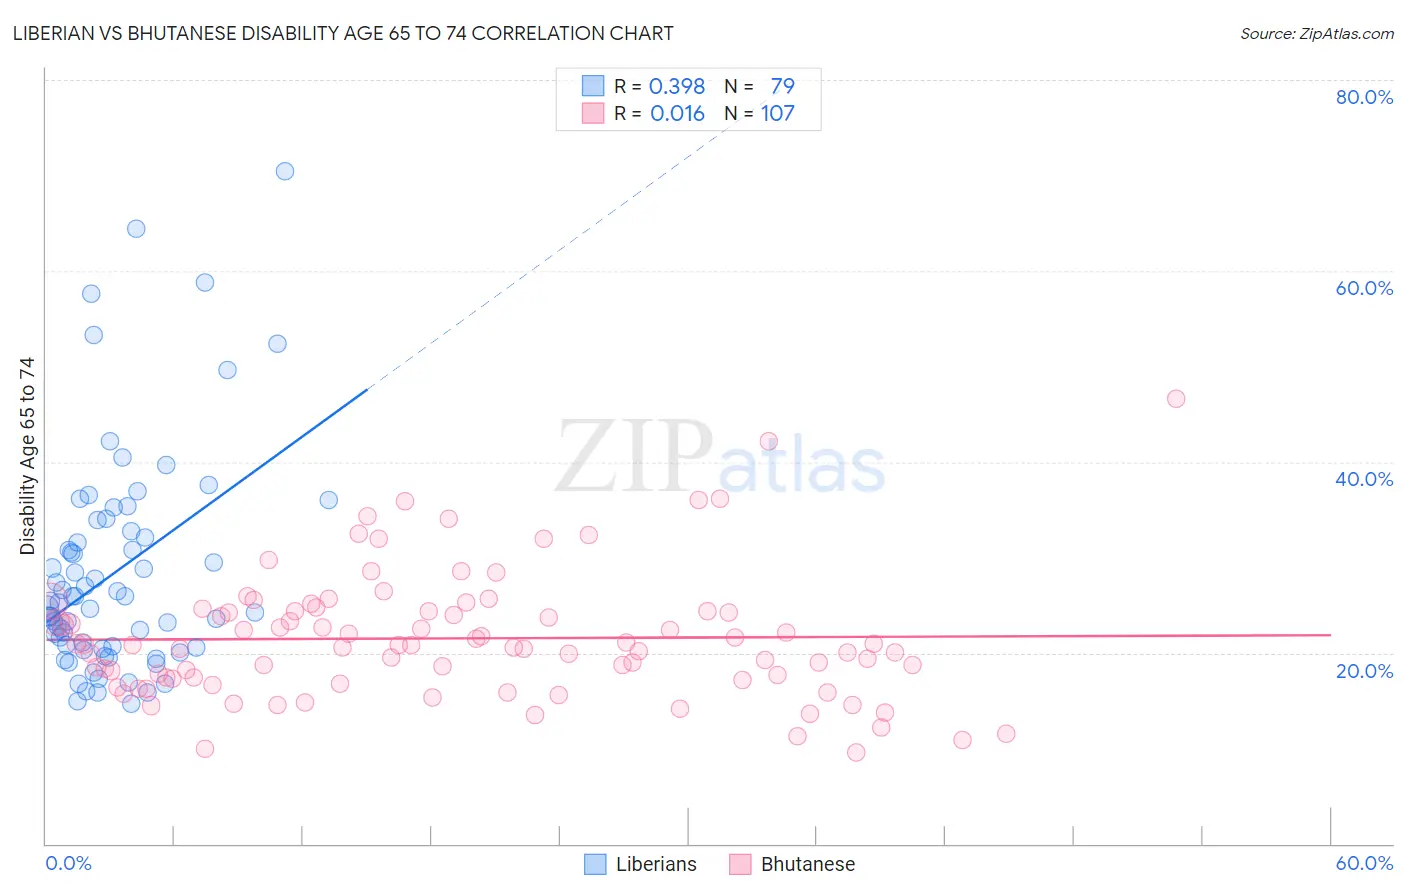
Liberian vs Bhutanese Disability Age 65 to 74 Correlation Chart
The statistical analysis conducted on geographies consisting of 117,958,133 people shows a mild positive correlation between the proportion of Liberians and percentage of population with a disability between the ages 65 and 75 in the United States with a correlation coefficient (R) of 0.398 and weighted average of 25.6%. Similarly, the statistical analysis conducted on geographies consisting of 454,236,804 people shows no correlation between the proportion of Bhutanese and percentage of population with a disability between the ages 65 and 75 in the United States with a correlation coefficient (R) of 0.016 and weighted average of 21.5%, a difference of 19.3%.
Disability Age 65 to 74 Correlation Summary
| Measurement | Liberian | Bhutanese |
| Minimum | 14.7% | 9.6% |
| Maximum | 70.5% | 46.7% |
| Range | 55.7% | 37.1% |
| Mean | 28.4% | 21.5% |
| Median | 25.2% | 20.8% |
| Interquartile 25% (IQ1) | 20.5% | 17.3% |
| Interquartile 75% (IQ3) | 32.7% | 24.3% |
| Interquartile Range (IQR) | 12.2% | 7.0% |
| Standard Deviation (Sample) | 11.5% | 6.6% |
| Standard Deviation (Population) | 11.5% | 6.6% |
Similar Demographics by Disability Age 65 to 74
Demographics Similar to Liberians by Disability Age 65 to 74
In terms of disability age 65 to 74, the demographic groups most similar to Liberians are Ottawa (25.6%, a difference of 0.10%), Hmong (25.7%, a difference of 0.12%), Immigrants from Guatemala (25.7%, a difference of 0.20%), Immigrants from Liberia (25.7%, a difference of 0.23%), and Immigrants from Dominica (25.7%, a difference of 0.23%).
| Demographics | Rating | Rank | Disability Age 65 to 74 |
| Cape Verdeans | 0.2 /100 | #261 | Tragic 25.4% |
| Samoans | 0.2 /100 | #262 | Tragic 25.4% |
| Iroquois | 0.2 /100 | #263 | Tragic 25.4% |
| Hawaiians | 0.2 /100 | #264 | Tragic 25.5% |
| Guatemalans | 0.2 /100 | #265 | Tragic 25.5% |
| Immigrants | Latin America | 0.1 /100 | #266 | Tragic 25.6% |
| Ottawa | 0.1 /100 | #267 | Tragic 25.6% |
| Liberians | 0.1 /100 | #268 | Tragic 25.6% |
| Hmong | 0.1 /100 | #269 | Tragic 25.7% |
| Immigrants | Guatemala | 0.1 /100 | #270 | Tragic 25.7% |
| Immigrants | Liberia | 0.1 /100 | #271 | Tragic 25.7% |
| Immigrants | Dominica | 0.1 /100 | #272 | Tragic 25.7% |
| Japanese | 0.1 /100 | #273 | Tragic 25.7% |
| Americans | 0.1 /100 | #274 | Tragic 25.8% |
| Hondurans | 0.1 /100 | #275 | Tragic 25.8% |
Demographics Similar to Bhutanese by Disability Age 65 to 74
In terms of disability age 65 to 74, the demographic groups most similar to Bhutanese are Immigrants from France (21.5%, a difference of 0.010%), Immigrants from Italy (21.5%, a difference of 0.010%), Immigrants from Romania (21.5%, a difference of 0.090%), Immigrants from Denmark (21.5%, a difference of 0.11%), and Immigrants from Asia (21.5%, a difference of 0.20%).
| Demographics | Rating | Rank | Disability Age 65 to 74 |
| Immigrants | Turkey | 99.7 /100 | #46 | Exceptional 21.4% |
| Immigrants | Bulgaria | 99.7 /100 | #47 | Exceptional 21.4% |
| Lithuanians | 99.7 /100 | #48 | Exceptional 21.4% |
| Luxembourgers | 99.7 /100 | #49 | Exceptional 21.4% |
| Immigrants | Malaysia | 99.7 /100 | #50 | Exceptional 21.4% |
| Immigrants | Serbia | 99.6 /100 | #51 | Exceptional 21.4% |
| Immigrants | France | 99.6 /100 | #52 | Exceptional 21.5% |
| Bhutanese | 99.6 /100 | #53 | Exceptional 21.5% |
| Immigrants | Italy | 99.6 /100 | #54 | Exceptional 21.5% |
| Immigrants | Romania | 99.5 /100 | #55 | Exceptional 21.5% |
| Immigrants | Denmark | 99.5 /100 | #56 | Exceptional 21.5% |
| Immigrants | Asia | 99.5 /100 | #57 | Exceptional 21.5% |
| Immigrants | Pakistan | 99.5 /100 | #58 | Exceptional 21.5% |
| Zimbabweans | 99.5 /100 | #59 | Exceptional 21.5% |
| Immigrants | North Macedonia | 99.5 /100 | #60 | Exceptional 21.6% |