Alaskan Athabascan vs Bhutanese Disability Age 65 to 74
COMPARE
Alaskan Athabascan
Bhutanese
Disability Age 65 to 74
Disability Age 65 to 74 Comparison
Alaskan Athabascans
Bhutanese
32.4%
DISABILITY AGE 65 TO 74
0.0/ 100
METRIC RATING
338th/ 347
METRIC RANK
21.5%
DISABILITY AGE 65 TO 74
99.6/ 100
METRIC RATING
53rd/ 347
METRIC RANK
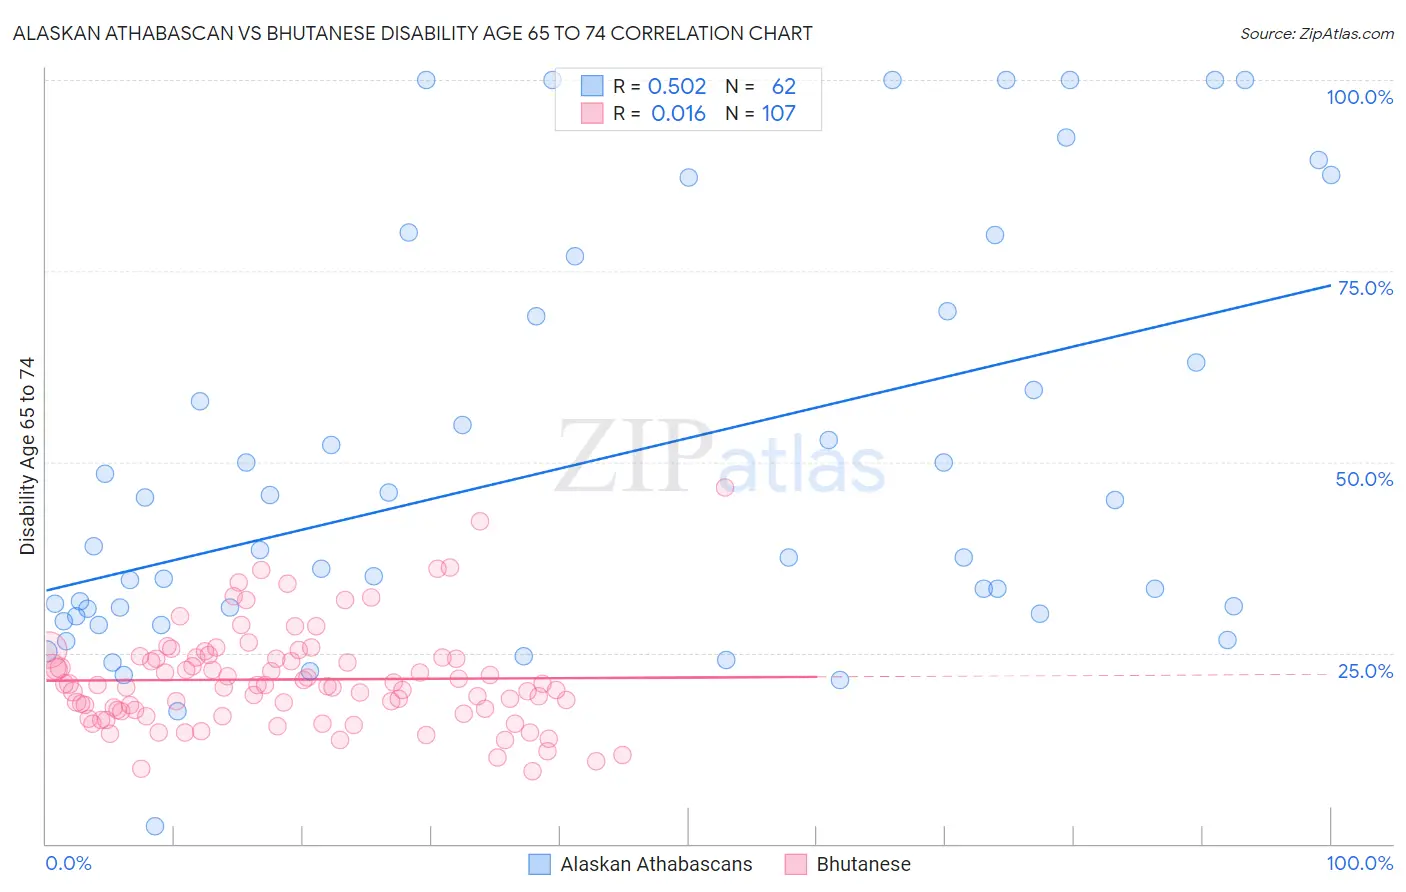
Alaskan Athabascan vs Bhutanese Disability Age 65 to 74 Correlation Chart
The statistical analysis conducted on geographies consisting of 45,797,821 people shows a substantial positive correlation between the proportion of Alaskan Athabascans and percentage of population with a disability between the ages 65 and 75 in the United States with a correlation coefficient (R) of 0.502 and weighted average of 32.4%. Similarly, the statistical analysis conducted on geographies consisting of 454,236,804 people shows no correlation between the proportion of Bhutanese and percentage of population with a disability between the ages 65 and 75 in the United States with a correlation coefficient (R) of 0.016 and weighted average of 21.5%, a difference of 50.5%.
Disability Age 65 to 74 Correlation Summary
| Measurement | Alaskan Athabascan | Bhutanese |
| Minimum | 2.3% | 9.6% |
| Maximum | 100.0% | 46.7% |
| Range | 97.7% | 37.1% |
| Mean | 49.4% | 21.5% |
| Median | 38.0% | 20.8% |
| Interquartile 25% (IQ1) | 30.1% | 17.3% |
| Interquartile 75% (IQ3) | 69.1% | 24.3% |
| Interquartile Range (IQR) | 39.0% | 7.0% |
| Standard Deviation (Sample) | 26.6% | 6.6% |
| Standard Deviation (Population) | 26.4% | 6.6% |
Similar Demographics by Disability Age 65 to 74
Demographics Similar to Alaskan Athabascans by Disability Age 65 to 74
In terms of disability age 65 to 74, the demographic groups most similar to Alaskan Athabascans are Houma (32.3%, a difference of 0.19%), Kiowa (32.6%, a difference of 0.62%), Lumbee (32.7%, a difference of 1.1%), Tsimshian (32.9%, a difference of 1.7%), and Pueblo (33.1%, a difference of 2.3%).
| Demographics | Rating | Rank | Disability Age 65 to 74 |
| Chickasaw | 0.0 /100 | #331 | Tragic 30.2% |
| Natives/Alaskans | 0.0 /100 | #332 | Tragic 30.4% |
| Colville | 0.0 /100 | #333 | Tragic 30.5% |
| Alaska Natives | 0.0 /100 | #334 | Tragic 30.6% |
| Cheyenne | 0.0 /100 | #335 | Tragic 31.1% |
| Yuman | 0.0 /100 | #336 | Tragic 31.5% |
| Houma | 0.0 /100 | #337 | Tragic 32.3% |
| Alaskan Athabascans | 0.0 /100 | #338 | Tragic 32.4% |
| Kiowa | 0.0 /100 | #339 | Tragic 32.6% |
| Lumbee | 0.0 /100 | #340 | Tragic 32.7% |
| Tsimshian | 0.0 /100 | #341 | Tragic 32.9% |
| Pueblo | 0.0 /100 | #342 | Tragic 33.1% |
| Navajo | 0.0 /100 | #343 | Tragic 33.3% |
| Inupiat | 0.0 /100 | #344 | Tragic 34.5% |
| Tohono O'odham | 0.0 /100 | #345 | Tragic 36.0% |
Demographics Similar to Bhutanese by Disability Age 65 to 74
In terms of disability age 65 to 74, the demographic groups most similar to Bhutanese are Immigrants from France (21.5%, a difference of 0.010%), Immigrants from Italy (21.5%, a difference of 0.010%), Immigrants from Romania (21.5%, a difference of 0.090%), Immigrants from Denmark (21.5%, a difference of 0.11%), and Immigrants from Asia (21.5%, a difference of 0.20%).
| Demographics | Rating | Rank | Disability Age 65 to 74 |
| Immigrants | Turkey | 99.7 /100 | #46 | Exceptional 21.4% |
| Immigrants | Bulgaria | 99.7 /100 | #47 | Exceptional 21.4% |
| Lithuanians | 99.7 /100 | #48 | Exceptional 21.4% |
| Luxembourgers | 99.7 /100 | #49 | Exceptional 21.4% |
| Immigrants | Malaysia | 99.7 /100 | #50 | Exceptional 21.4% |
| Immigrants | Serbia | 99.6 /100 | #51 | Exceptional 21.4% |
| Immigrants | France | 99.6 /100 | #52 | Exceptional 21.5% |
| Bhutanese | 99.6 /100 | #53 | Exceptional 21.5% |
| Immigrants | Italy | 99.6 /100 | #54 | Exceptional 21.5% |
| Immigrants | Romania | 99.5 /100 | #55 | Exceptional 21.5% |
| Immigrants | Denmark | 99.5 /100 | #56 | Exceptional 21.5% |
| Immigrants | Asia | 99.5 /100 | #57 | Exceptional 21.5% |
| Immigrants | Pakistan | 99.5 /100 | #58 | Exceptional 21.5% |
| Zimbabweans | 99.5 /100 | #59 | Exceptional 21.5% |
| Immigrants | North Macedonia | 99.5 /100 | #60 | Exceptional 21.6% |