Russian vs Bhutanese Disability Age 65 to 74
COMPARE
Russian
Bhutanese
Disability Age 65 to 74
Disability Age 65 to 74 Comparison
Russians
Bhutanese
21.2%
DISABILITY AGE 65 TO 74
99.8/ 100
METRIC RATING
38th/ 347
METRIC RANK
21.5%
DISABILITY AGE 65 TO 74
99.6/ 100
METRIC RATING
53rd/ 347
METRIC RANK
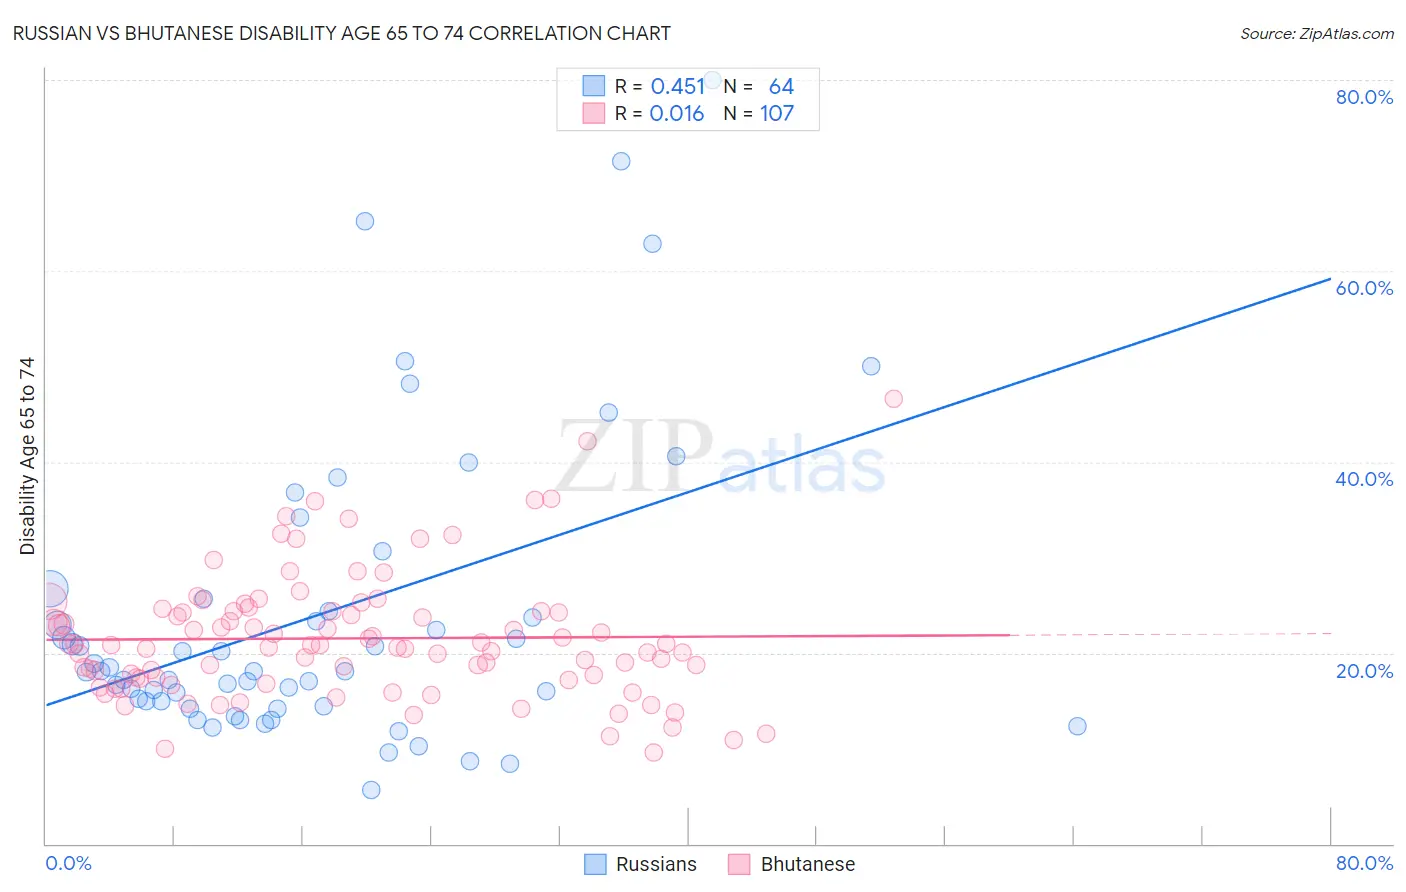
Russian vs Bhutanese Disability Age 65 to 74 Correlation Chart
The statistical analysis conducted on geographies consisting of 510,598,178 people shows a moderate positive correlation between the proportion of Russians and percentage of population with a disability between the ages 65 and 75 in the United States with a correlation coefficient (R) of 0.451 and weighted average of 21.2%. Similarly, the statistical analysis conducted on geographies consisting of 454,236,804 people shows no correlation between the proportion of Bhutanese and percentage of population with a disability between the ages 65 and 75 in the United States with a correlation coefficient (R) of 0.016 and weighted average of 21.5%, a difference of 1.6%.
Disability Age 65 to 74 Correlation Summary
| Measurement | Russian | Bhutanese |
| Minimum | 5.7% | 9.6% |
| Maximum | 80.0% | 46.7% |
| Range | 74.3% | 37.1% |
| Mean | 23.9% | 21.5% |
| Median | 18.1% | 20.8% |
| Interquartile 25% (IQ1) | 14.7% | 17.3% |
| Interquartile 75% (IQ3) | 25.0% | 24.3% |
| Interquartile Range (IQR) | 10.4% | 7.0% |
| Standard Deviation (Sample) | 15.8% | 6.6% |
| Standard Deviation (Population) | 15.7% | 6.6% |
Demographics Similar to Russians and Bhutanese by Disability Age 65 to 74
In terms of disability age 65 to 74, the demographic groups most similar to Russians are Israeli (21.2%, a difference of 0.0%), Immigrants from Switzerland (21.1%, a difference of 0.11%), Argentinean (21.2%, a difference of 0.18%), Bulgarian (21.1%, a difference of 0.30%), and Latvian (21.2%, a difference of 0.35%). Similarly, the demographic groups most similar to Bhutanese are Immigrants from France (21.5%, a difference of 0.010%), Immigrants from Italy (21.5%, a difference of 0.010%), Immigrants from Romania (21.5%, a difference of 0.090%), Immigrants from Serbia (21.4%, a difference of 0.23%), and Immigrants from Malaysia (21.4%, a difference of 0.45%).
| Demographics | Rating | Rank | Disability Age 65 to 74 |
| Bulgarians | 99.9 /100 | #35 | Exceptional 21.1% |
| Immigrants | Switzerland | 99.8 /100 | #36 | Exceptional 21.1% |
| Israelis | 99.8 /100 | #37 | Exceptional 21.2% |
| Russians | 99.8 /100 | #38 | Exceptional 21.2% |
| Argentineans | 99.8 /100 | #39 | Exceptional 21.2% |
| Latvians | 99.8 /100 | #40 | Exceptional 21.2% |
| Immigrants | Austria | 99.8 /100 | #41 | Exceptional 21.2% |
| Macedonians | 99.7 /100 | #42 | Exceptional 21.3% |
| Immigrants | Croatia | 99.7 /100 | #43 | Exceptional 21.3% |
| Estonians | 99.7 /100 | #44 | Exceptional 21.4% |
| Asians | 99.7 /100 | #45 | Exceptional 21.4% |
| Immigrants | Turkey | 99.7 /100 | #46 | Exceptional 21.4% |
| Immigrants | Bulgaria | 99.7 /100 | #47 | Exceptional 21.4% |
| Lithuanians | 99.7 /100 | #48 | Exceptional 21.4% |
| Luxembourgers | 99.7 /100 | #49 | Exceptional 21.4% |
| Immigrants | Malaysia | 99.7 /100 | #50 | Exceptional 21.4% |
| Immigrants | Serbia | 99.6 /100 | #51 | Exceptional 21.4% |
| Immigrants | France | 99.6 /100 | #52 | Exceptional 21.5% |
| Bhutanese | 99.6 /100 | #53 | Exceptional 21.5% |
| Immigrants | Italy | 99.6 /100 | #54 | Exceptional 21.5% |
| Immigrants | Romania | 99.5 /100 | #55 | Exceptional 21.5% |