Scandinavian vs Immigrants from Morocco Female Disability
COMPARE
Scandinavian
Immigrants from Morocco
Female Disability
Female Disability Comparison
Scandinavians
Immigrants from Morocco
12.5%
FEMALE DISABILITY
5.3/ 100
METRIC RATING
234th/ 347
METRIC RANK
11.8%
FEMALE DISABILITY
97.6/ 100
METRIC RATING
116th/ 347
METRIC RANK
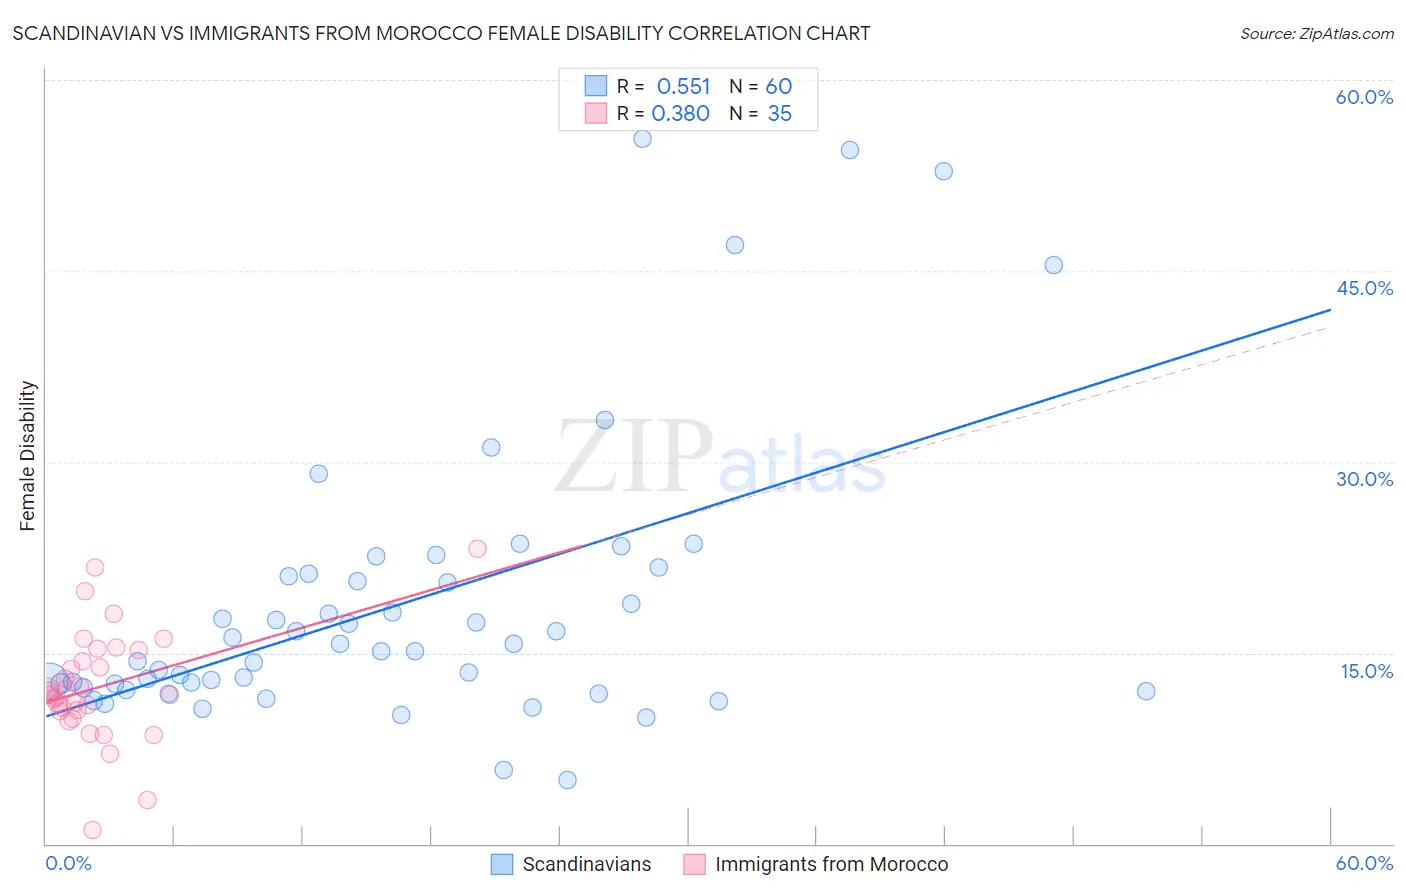
Scandinavian vs Immigrants from Morocco Female Disability Correlation Chart
The statistical analysis conducted on geographies consisting of 472,506,229 people shows a substantial positive correlation between the proportion of Scandinavians and percentage of females with a disability in the United States with a correlation coefficient (R) of 0.551 and weighted average of 12.5%. Similarly, the statistical analysis conducted on geographies consisting of 178,909,163 people shows a mild positive correlation between the proportion of Immigrants from Morocco and percentage of females with a disability in the United States with a correlation coefficient (R) of 0.380 and weighted average of 11.8%, a difference of 6.4%.
Female Disability Correlation Summary
| Measurement | Scandinavian | Immigrants from Morocco |
| Minimum | 5.0% | 1.0% |
| Maximum | 55.4% | 23.2% |
| Range | 50.4% | 22.1% |
| Mean | 18.9% | 12.3% |
| Median | 15.4% | 11.7% |
| Interquartile 25% (IQ1) | 12.4% | 10.4% |
| Interquartile 75% (IQ3) | 21.1% | 15.3% |
| Interquartile Range (IQR) | 8.7% | 4.8% |
| Standard Deviation (Sample) | 11.3% | 4.4% |
| Standard Deviation (Population) | 11.2% | 4.4% |
Similar Demographics by Female Disability
Demographics Similar to Scandinavians by Female Disability
In terms of female disability, the demographic groups most similar to Scandinavians are Immigrants from Iraq (12.5%, a difference of 0.010%), Malaysian (12.5%, a difference of 0.050%), Immigrants from Somalia (12.5%, a difference of 0.11%), Immigrants from West Indies (12.6%, a difference of 0.18%), and Belgian (12.5%, a difference of 0.20%).
| Demographics | Rating | Rank | Female Disability |
| Assyrians/Chaldeans/Syriacs | 8.0 /100 | #227 | Tragic 12.5% |
| Immigrants | Cambodia | 7.8 /100 | #228 | Tragic 12.5% |
| Hungarians | 7.2 /100 | #229 | Tragic 12.5% |
| Immigrants | Belize | 7.0 /100 | #230 | Tragic 12.5% |
| Belgians | 6.5 /100 | #231 | Tragic 12.5% |
| Immigrants | Somalia | 5.9 /100 | #232 | Tragic 12.5% |
| Immigrants | Iraq | 5.3 /100 | #233 | Tragic 12.5% |
| Scandinavians | 5.3 /100 | #234 | Tragic 12.5% |
| Malaysians | 5.0 /100 | #235 | Tragic 12.5% |
| Immigrants | West Indies | 4.4 /100 | #236 | Tragic 12.6% |
| Slavs | 3.8 /100 | #237 | Tragic 12.6% |
| Yugoslavians | 3.7 /100 | #238 | Tragic 12.6% |
| Barbadians | 3.6 /100 | #239 | Tragic 12.6% |
| German Russians | 3.2 /100 | #240 | Tragic 12.6% |
| Japanese | 2.7 /100 | #241 | Tragic 12.6% |
Demographics Similar to Immigrants from Morocco by Female Disability
In terms of female disability, the demographic groups most similar to Immigrants from Morocco are Brazilian (11.8%, a difference of 0.040%), South African (11.8%, a difference of 0.050%), Immigrants from Belarus (11.8%, a difference of 0.070%), Immigrants from Bangladesh (11.8%, a difference of 0.090%), and Immigrants from Eastern Europe (11.8%, a difference of 0.15%).
| Demographics | Rating | Rank | Female Disability |
| Immigrants | Immigrants | 98.1 /100 | #109 | Exceptional 11.7% |
| Soviet Union | 98.1 /100 | #110 | Exceptional 11.7% |
| Costa Ricans | 98.1 /100 | #111 | Exceptional 11.7% |
| Immigrants | Bangladesh | 97.8 /100 | #112 | Exceptional 11.8% |
| Immigrants | Belarus | 97.8 /100 | #113 | Exceptional 11.8% |
| South Africans | 97.7 /100 | #114 | Exceptional 11.8% |
| Brazilians | 97.7 /100 | #115 | Exceptional 11.8% |
| Immigrants | Morocco | 97.6 /100 | #116 | Exceptional 11.8% |
| Immigrants | Eastern Europe | 97.2 /100 | #117 | Exceptional 11.8% |
| Immigrants | Nigeria | 97.2 /100 | #118 | Exceptional 11.8% |
| Immigrants | Uganda | 97.2 /100 | #119 | Exceptional 11.8% |
| Immigrants | Kazakhstan | 97.0 /100 | #120 | Exceptional 11.8% |
| Immigrants | Netherlands | 96.9 /100 | #121 | Exceptional 11.8% |
| Immigrants | North Macedonia | 96.8 /100 | #122 | Exceptional 11.8% |
| Immigrants | Croatia | 96.7 /100 | #123 | Exceptional 11.8% |