Korean vs Immigrants from Morocco Female Disability
COMPARE
Korean
Immigrants from Morocco
Female Disability
Female Disability Comparison
Koreans
Immigrants from Morocco
11.7%
FEMALE DISABILITY
99.0/ 100
METRIC RATING
97th/ 347
METRIC RANK
11.8%
FEMALE DISABILITY
97.6/ 100
METRIC RATING
116th/ 347
METRIC RANK
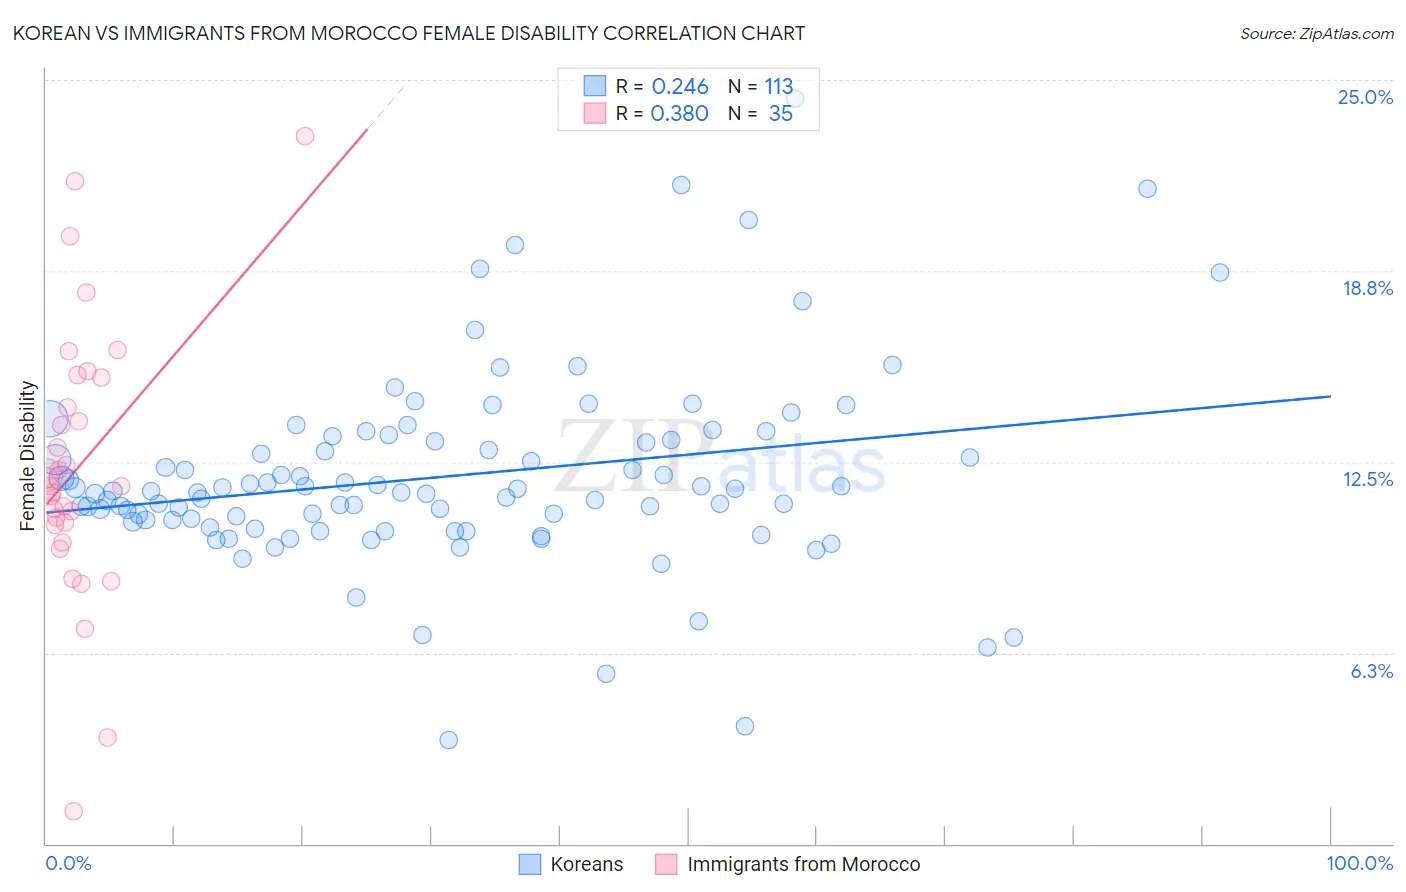
Korean vs Immigrants from Morocco Female Disability Correlation Chart
The statistical analysis conducted on geographies consisting of 510,799,967 people shows a weak positive correlation between the proportion of Koreans and percentage of females with a disability in the United States with a correlation coefficient (R) of 0.246 and weighted average of 11.7%. Similarly, the statistical analysis conducted on geographies consisting of 178,909,163 people shows a mild positive correlation between the proportion of Immigrants from Morocco and percentage of females with a disability in the United States with a correlation coefficient (R) of 0.380 and weighted average of 11.8%, a difference of 0.86%.
Female Disability Correlation Summary
| Measurement | Korean | Immigrants from Morocco |
| Minimum | 3.4% | 1.0% |
| Maximum | 24.4% | 23.2% |
| Range | 21.0% | 22.1% |
| Mean | 12.0% | 12.3% |
| Median | 11.5% | 11.7% |
| Interquartile 25% (IQ1) | 10.6% | 10.4% |
| Interquartile 75% (IQ3) | 13.2% | 15.3% |
| Interquartile Range (IQR) | 2.6% | 4.8% |
| Standard Deviation (Sample) | 3.2% | 4.4% |
| Standard Deviation (Population) | 3.2% | 4.4% |
Demographics Similar to Koreans and Immigrants from Morocco by Female Disability
In terms of female disability, the demographic groups most similar to Koreans are Immigrants from Russia (11.7%, a difference of 0.0%), Uruguayan (11.7%, a difference of 0.14%), Immigrants from Philippines (11.7%, a difference of 0.35%), Immigrants from Uruguay (11.7%, a difference of 0.40%), and Immigrants from Costa Rica (11.7%, a difference of 0.42%). Similarly, the demographic groups most similar to Immigrants from Morocco are Brazilian (11.8%, a difference of 0.040%), South African (11.8%, a difference of 0.050%), Immigrants from Belarus (11.8%, a difference of 0.070%), Immigrants from Bangladesh (11.8%, a difference of 0.090%), and Costa Rican (11.7%, a difference of 0.21%).
| Demographics | Rating | Rank | Female Disability |
| Immigrants | Russia | 99.0 /100 | #96 | Exceptional 11.7% |
| Koreans | 99.0 /100 | #97 | Exceptional 11.7% |
| Uruguayans | 98.8 /100 | #98 | Exceptional 11.7% |
| Immigrants | Philippines | 98.6 /100 | #99 | Exceptional 11.7% |
| Immigrants | Uruguay | 98.5 /100 | #100 | Exceptional 11.7% |
| Immigrants | Costa Rica | 98.4 /100 | #101 | Exceptional 11.7% |
| Immigrants | South Eastern Asia | 98.4 /100 | #102 | Exceptional 11.7% |
| Immigrants | Eastern Africa | 98.3 /100 | #103 | Exceptional 11.7% |
| Immigrants | Western Asia | 98.3 /100 | #104 | Exceptional 11.7% |
| Australians | 98.3 /100 | #105 | Exceptional 11.7% |
| Immigrants | Greece | 98.2 /100 | #106 | Exceptional 11.7% |
| Latvians | 98.2 /100 | #107 | Exceptional 11.7% |
| New Zealanders | 98.1 /100 | #108 | Exceptional 11.7% |
| Immigrants | Immigrants | 98.1 /100 | #109 | Exceptional 11.7% |
| Soviet Union | 98.1 /100 | #110 | Exceptional 11.7% |
| Costa Ricans | 98.1 /100 | #111 | Exceptional 11.7% |
| Immigrants | Bangladesh | 97.8 /100 | #112 | Exceptional 11.8% |
| Immigrants | Belarus | 97.8 /100 | #113 | Exceptional 11.8% |
| South Africans | 97.7 /100 | #114 | Exceptional 11.8% |
| Brazilians | 97.7 /100 | #115 | Exceptional 11.8% |
| Immigrants | Morocco | 97.6 /100 | #116 | Exceptional 11.8% |