Scandinavian vs Chippewa Female Disability
COMPARE
Scandinavian
Chippewa
Female Disability
Female Disability Comparison
Scandinavians
Chippewa
12.5%
FEMALE DISABILITY
5.3/ 100
METRIC RATING
234th/ 347
METRIC RANK
14.0%
FEMALE DISABILITY
0.0/ 100
METRIC RATING
317th/ 347
METRIC RANK
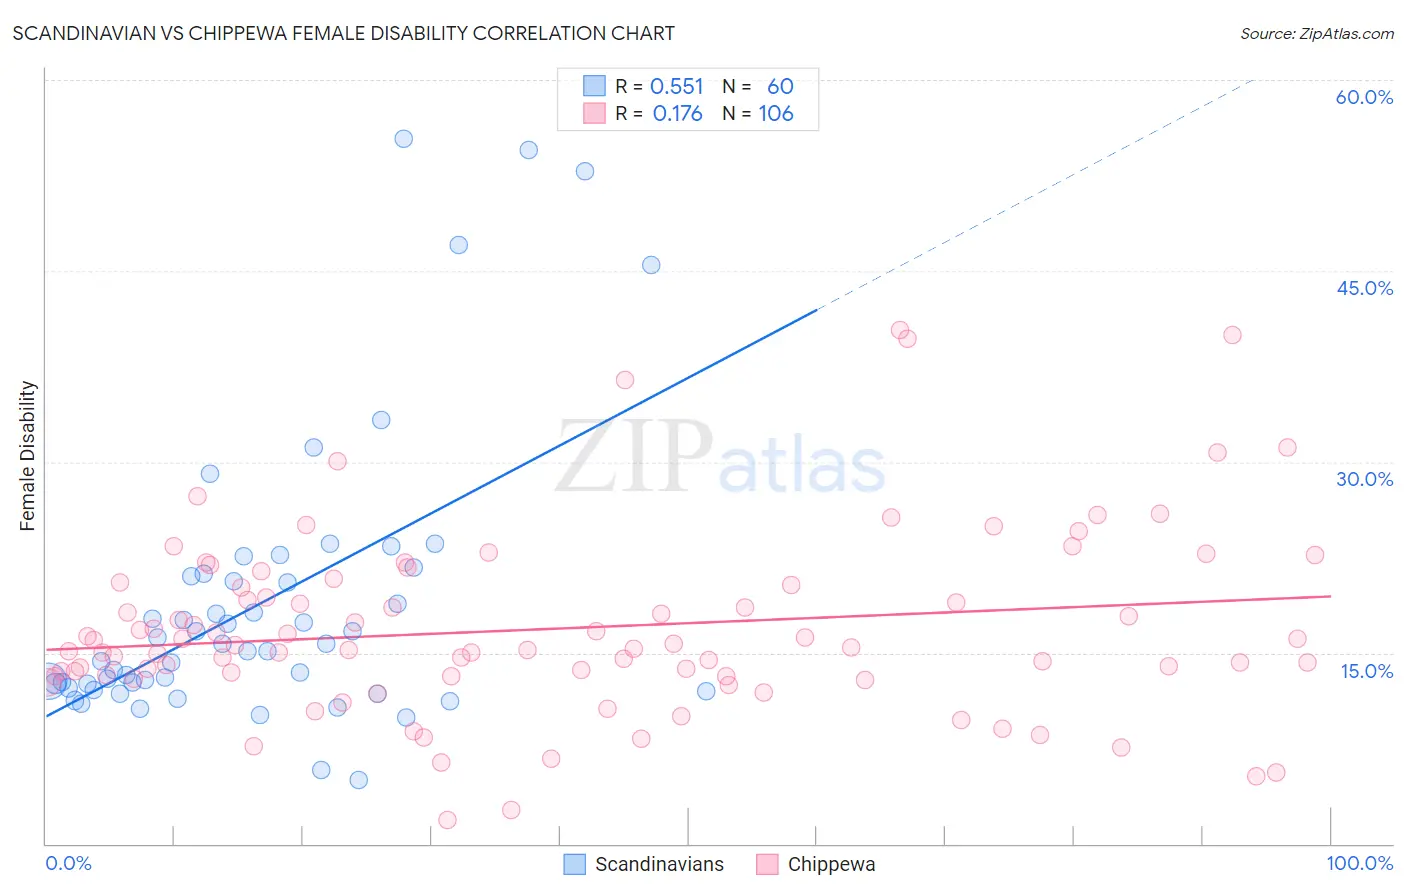
Scandinavian vs Chippewa Female Disability Correlation Chart
The statistical analysis conducted on geographies consisting of 472,506,229 people shows a substantial positive correlation between the proportion of Scandinavians and percentage of females with a disability in the United States with a correlation coefficient (R) of 0.551 and weighted average of 12.5%. Similarly, the statistical analysis conducted on geographies consisting of 215,042,988 people shows a poor positive correlation between the proportion of Chippewa and percentage of females with a disability in the United States with a correlation coefficient (R) of 0.176 and weighted average of 14.0%, a difference of 11.7%.
Female Disability Correlation Summary
| Measurement | Scandinavian | Chippewa |
| Minimum | 5.0% | 1.9% |
| Maximum | 55.4% | 40.4% |
| Range | 50.4% | 38.5% |
| Mean | 18.9% | 16.9% |
| Median | 15.4% | 15.4% |
| Interquartile 25% (IQ1) | 12.4% | 13.1% |
| Interquartile 75% (IQ3) | 21.1% | 20.3% |
| Interquartile Range (IQR) | 8.7% | 7.2% |
| Standard Deviation (Sample) | 11.3% | 7.2% |
| Standard Deviation (Population) | 11.2% | 7.2% |
Similar Demographics by Female Disability
Demographics Similar to Scandinavians by Female Disability
In terms of female disability, the demographic groups most similar to Scandinavians are Immigrants from Iraq (12.5%, a difference of 0.010%), Malaysian (12.5%, a difference of 0.050%), Immigrants from Somalia (12.5%, a difference of 0.11%), Immigrants from West Indies (12.6%, a difference of 0.18%), and Belgian (12.5%, a difference of 0.20%).
| Demographics | Rating | Rank | Female Disability |
| Assyrians/Chaldeans/Syriacs | 8.0 /100 | #227 | Tragic 12.5% |
| Immigrants | Cambodia | 7.8 /100 | #228 | Tragic 12.5% |
| Hungarians | 7.2 /100 | #229 | Tragic 12.5% |
| Immigrants | Belize | 7.0 /100 | #230 | Tragic 12.5% |
| Belgians | 6.5 /100 | #231 | Tragic 12.5% |
| Immigrants | Somalia | 5.9 /100 | #232 | Tragic 12.5% |
| Immigrants | Iraq | 5.3 /100 | #233 | Tragic 12.5% |
| Scandinavians | 5.3 /100 | #234 | Tragic 12.5% |
| Malaysians | 5.0 /100 | #235 | Tragic 12.5% |
| Immigrants | West Indies | 4.4 /100 | #236 | Tragic 12.6% |
| Slavs | 3.8 /100 | #237 | Tragic 12.6% |
| Yugoslavians | 3.7 /100 | #238 | Tragic 12.6% |
| Barbadians | 3.6 /100 | #239 | Tragic 12.6% |
| German Russians | 3.2 /100 | #240 | Tragic 12.6% |
| Japanese | 2.7 /100 | #241 | Tragic 12.6% |
Demographics Similar to Chippewa by Female Disability
In terms of female disability, the demographic groups most similar to Chippewa are Spanish American (14.0%, a difference of 0.11%), Paiute (14.0%, a difference of 0.11%), Iroquois (14.0%, a difference of 0.40%), Alaskan Athabascan (13.9%, a difference of 0.47%), and American (14.1%, a difference of 0.74%).
| Demographics | Rating | Rank | Female Disability |
| Apache | 0.0 /100 | #310 | Tragic 13.7% |
| Hopi | 0.0 /100 | #311 | Tragic 13.7% |
| Delaware | 0.0 /100 | #312 | Tragic 13.8% |
| Blackfeet | 0.0 /100 | #313 | Tragic 13.8% |
| Puget Sound Salish | 0.0 /100 | #314 | Tragic 13.8% |
| Alaskan Athabascans | 0.0 /100 | #315 | Tragic 13.9% |
| Spanish Americans | 0.0 /100 | #316 | Tragic 14.0% |
| Chippewa | 0.0 /100 | #317 | Tragic 14.0% |
| Paiute | 0.0 /100 | #318 | Tragic 14.0% |
| Iroquois | 0.0 /100 | #319 | Tragic 14.0% |
| Americans | 0.0 /100 | #320 | Tragic 14.1% |
| Potawatomi | 0.0 /100 | #321 | Tragic 14.1% |
| Pueblo | 0.0 /100 | #322 | Tragic 14.1% |
| Blacks/African Americans | 0.0 /100 | #323 | Tragic 14.1% |
| Natives/Alaskans | 0.0 /100 | #324 | Tragic 14.1% |