Scandinavian vs Cuban Female Disability
COMPARE
Scandinavian
Cuban
Female Disability
Female Disability Comparison
Scandinavians
Cubans
12.5%
FEMALE DISABILITY
5.3/ 100
METRIC RATING
234th/ 347
METRIC RANK
12.3%
FEMALE DISABILITY
36.5/ 100
METRIC RATING
183rd/ 347
METRIC RANK
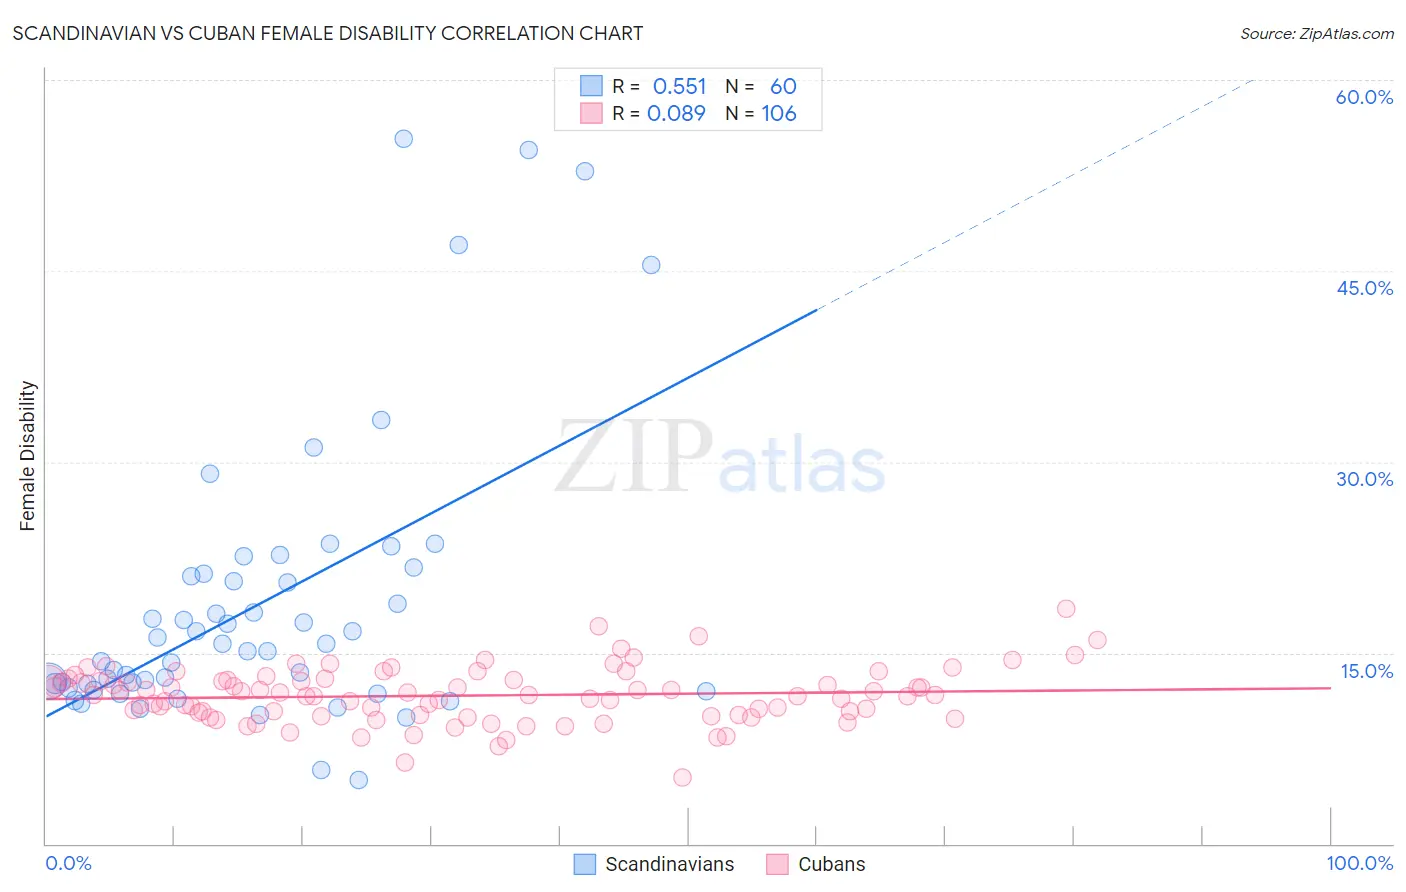
Scandinavian vs Cuban Female Disability Correlation Chart
The statistical analysis conducted on geographies consisting of 472,506,229 people shows a substantial positive correlation between the proportion of Scandinavians and percentage of females with a disability in the United States with a correlation coefficient (R) of 0.551 and weighted average of 12.5%. Similarly, the statistical analysis conducted on geographies consisting of 449,245,212 people shows a slight positive correlation between the proportion of Cubans and percentage of females with a disability in the United States with a correlation coefficient (R) of 0.089 and weighted average of 12.3%, a difference of 2.2%.
Female Disability Correlation Summary
| Measurement | Scandinavian | Cuban |
| Minimum | 5.0% | 5.2% |
| Maximum | 55.4% | 18.5% |
| Range | 50.4% | 13.3% |
| Mean | 18.9% | 11.6% |
| Median | 15.4% | 11.7% |
| Interquartile 25% (IQ1) | 12.4% | 10.1% |
| Interquartile 75% (IQ3) | 21.1% | 12.8% |
| Interquartile Range (IQR) | 8.7% | 2.7% |
| Standard Deviation (Sample) | 11.3% | 2.1% |
| Standard Deviation (Population) | 11.2% | 2.1% |
Similar Demographics by Female Disability
Demographics Similar to Scandinavians by Female Disability
In terms of female disability, the demographic groups most similar to Scandinavians are Immigrants from Iraq (12.5%, a difference of 0.010%), Malaysian (12.5%, a difference of 0.050%), Immigrants from Somalia (12.5%, a difference of 0.11%), Immigrants from West Indies (12.6%, a difference of 0.18%), and Belgian (12.5%, a difference of 0.20%).
| Demographics | Rating | Rank | Female Disability |
| Assyrians/Chaldeans/Syriacs | 8.0 /100 | #227 | Tragic 12.5% |
| Immigrants | Cambodia | 7.8 /100 | #228 | Tragic 12.5% |
| Hungarians | 7.2 /100 | #229 | Tragic 12.5% |
| Immigrants | Belize | 7.0 /100 | #230 | Tragic 12.5% |
| Belgians | 6.5 /100 | #231 | Tragic 12.5% |
| Immigrants | Somalia | 5.9 /100 | #232 | Tragic 12.5% |
| Immigrants | Iraq | 5.3 /100 | #233 | Tragic 12.5% |
| Scandinavians | 5.3 /100 | #234 | Tragic 12.5% |
| Malaysians | 5.0 /100 | #235 | Tragic 12.5% |
| Immigrants | West Indies | 4.4 /100 | #236 | Tragic 12.6% |
| Slavs | 3.8 /100 | #237 | Tragic 12.6% |
| Yugoslavians | 3.7 /100 | #238 | Tragic 12.6% |
| Barbadians | 3.6 /100 | #239 | Tragic 12.6% |
| German Russians | 3.2 /100 | #240 | Tragic 12.6% |
| Japanese | 2.7 /100 | #241 | Tragic 12.6% |
Demographics Similar to Cubans by Female Disability
In terms of female disability, the demographic groups most similar to Cubans are Norwegian (12.3%, a difference of 0.020%), Iraqi (12.3%, a difference of 0.020%), Immigrants from Canada (12.3%, a difference of 0.030%), Albanian (12.3%, a difference of 0.060%), and Immigrants from Fiji (12.3%, a difference of 0.070%).
| Demographics | Rating | Rank | Female Disability |
| Immigrants | Guyana | 43.1 /100 | #176 | Average 12.2% |
| Immigrants | Ghana | 42.5 /100 | #177 | Average 12.2% |
| Immigrants | Western Europe | 40.9 /100 | #178 | Average 12.2% |
| Immigrants | Fiji | 38.2 /100 | #179 | Fair 12.3% |
| Albanians | 37.9 /100 | #180 | Fair 12.3% |
| Immigrants | Canada | 37.2 /100 | #181 | Fair 12.3% |
| Norwegians | 36.9 /100 | #182 | Fair 12.3% |
| Cubans | 36.5 /100 | #183 | Fair 12.3% |
| Iraqis | 36.0 /100 | #184 | Fair 12.3% |
| Immigrants | Uzbekistan | 33.9 /100 | #185 | Fair 12.3% |
| Austrians | 33.3 /100 | #186 | Fair 12.3% |
| Serbians | 33.1 /100 | #187 | Fair 12.3% |
| Immigrants | North America | 32.8 /100 | #188 | Fair 12.3% |
| Immigrants | Albania | 31.6 /100 | #189 | Fair 12.3% |
| Immigrants | Honduras | 31.3 /100 | #190 | Fair 12.3% |