Somali vs Immigrants from Morocco Female Disability
COMPARE
Somali
Immigrants from Morocco
Female Disability
Female Disability Comparison
Somalis
Immigrants from Morocco
12.3%
FEMALE DISABILITY
21.5/ 100
METRIC RATING
202nd/ 347
METRIC RANK
11.8%
FEMALE DISABILITY
97.6/ 100
METRIC RATING
116th/ 347
METRIC RANK
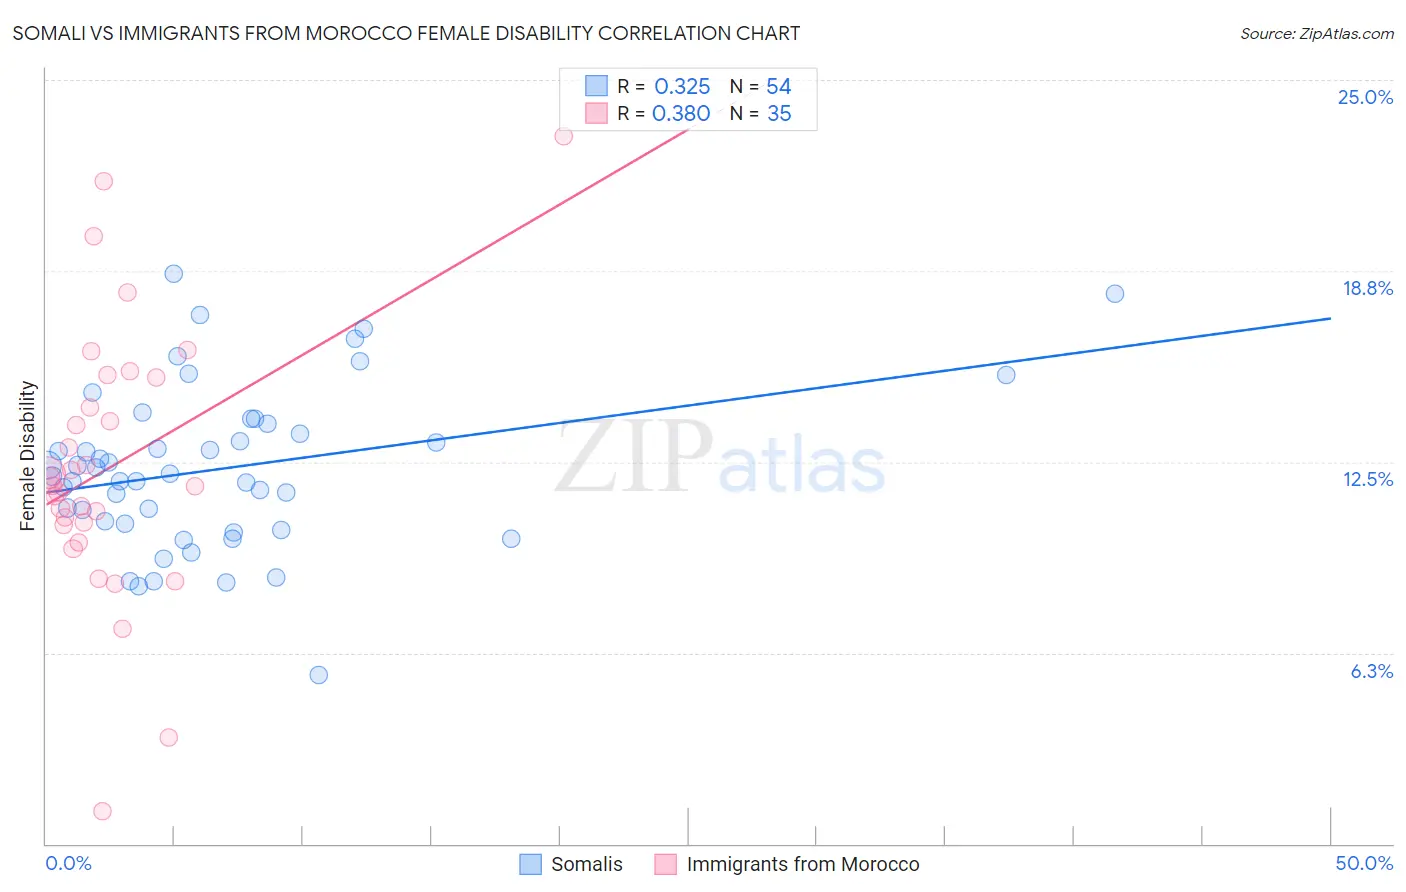
Somali vs Immigrants from Morocco Female Disability Correlation Chart
The statistical analysis conducted on geographies consisting of 99,314,959 people shows a mild positive correlation between the proportion of Somalis and percentage of females with a disability in the United States with a correlation coefficient (R) of 0.325 and weighted average of 12.3%. Similarly, the statistical analysis conducted on geographies consisting of 178,909,163 people shows a mild positive correlation between the proportion of Immigrants from Morocco and percentage of females with a disability in the United States with a correlation coefficient (R) of 0.380 and weighted average of 11.8%, a difference of 4.9%.
Female Disability Correlation Summary
| Measurement | Somali | Immigrants from Morocco |
| Minimum | 5.5% | 1.0% |
| Maximum | 18.6% | 23.2% |
| Range | 13.1% | 22.1% |
| Mean | 12.3% | 12.3% |
| Median | 12.1% | 11.7% |
| Interquartile 25% (IQ1) | 10.5% | 10.4% |
| Interquartile 75% (IQ3) | 13.7% | 15.3% |
| Interquartile Range (IQR) | 3.3% | 4.8% |
| Standard Deviation (Sample) | 2.7% | 4.4% |
| Standard Deviation (Population) | 2.6% | 4.4% |
Similar Demographics by Female Disability
Demographics Similar to Somalis by Female Disability
In terms of female disability, the demographic groups most similar to Somalis are Immigrants from Barbados (12.3%, a difference of 0.020%), Chinese (12.3%, a difference of 0.030%), Trinidadian and Tobagonian (12.3%, a difference of 0.040%), Immigrants from Zaire (12.3%, a difference of 0.040%), and Immigrants from Grenada (12.4%, a difference of 0.060%).
| Demographics | Rating | Rank | Female Disability |
| Swedes | 26.6 /100 | #195 | Fair 12.3% |
| Immigrants | Panama | 25.5 /100 | #196 | Fair 12.3% |
| Hondurans | 25.4 /100 | #197 | Fair 12.3% |
| Mexican American Indians | 24.9 /100 | #198 | Fair 12.3% |
| Immigrants | Trinidad and Tobago | 24.7 /100 | #199 | Fair 12.3% |
| Trinidadians and Tobagonians | 22.4 /100 | #200 | Fair 12.3% |
| Chinese | 22.1 /100 | #201 | Fair 12.3% |
| Somalis | 21.5 /100 | #202 | Fair 12.3% |
| Immigrants | Barbados | 21.1 /100 | #203 | Fair 12.3% |
| Immigrants | Zaire | 20.9 /100 | #204 | Fair 12.3% |
| Immigrants | Grenada | 20.5 /100 | #205 | Fair 12.4% |
| Immigrants | Cuba | 20.2 /100 | #206 | Fair 12.4% |
| Croatians | 20.2 /100 | #207 | Fair 12.4% |
| Basques | 17.5 /100 | #208 | Poor 12.4% |
| Mexicans | 15.7 /100 | #209 | Poor 12.4% |
Demographics Similar to Immigrants from Morocco by Female Disability
In terms of female disability, the demographic groups most similar to Immigrants from Morocco are Brazilian (11.8%, a difference of 0.040%), South African (11.8%, a difference of 0.050%), Immigrants from Belarus (11.8%, a difference of 0.070%), Immigrants from Bangladesh (11.8%, a difference of 0.090%), and Immigrants from Eastern Europe (11.8%, a difference of 0.15%).
| Demographics | Rating | Rank | Female Disability |
| Immigrants | Immigrants | 98.1 /100 | #109 | Exceptional 11.7% |
| Soviet Union | 98.1 /100 | #110 | Exceptional 11.7% |
| Costa Ricans | 98.1 /100 | #111 | Exceptional 11.7% |
| Immigrants | Bangladesh | 97.8 /100 | #112 | Exceptional 11.8% |
| Immigrants | Belarus | 97.8 /100 | #113 | Exceptional 11.8% |
| South Africans | 97.7 /100 | #114 | Exceptional 11.8% |
| Brazilians | 97.7 /100 | #115 | Exceptional 11.8% |
| Immigrants | Morocco | 97.6 /100 | #116 | Exceptional 11.8% |
| Immigrants | Eastern Europe | 97.2 /100 | #117 | Exceptional 11.8% |
| Immigrants | Nigeria | 97.2 /100 | #118 | Exceptional 11.8% |
| Immigrants | Uganda | 97.2 /100 | #119 | Exceptional 11.8% |
| Immigrants | Kazakhstan | 97.0 /100 | #120 | Exceptional 11.8% |
| Immigrants | Netherlands | 96.9 /100 | #121 | Exceptional 11.8% |
| Immigrants | North Macedonia | 96.8 /100 | #122 | Exceptional 11.8% |
| Immigrants | Croatia | 96.7 /100 | #123 | Exceptional 11.8% |