Scandinavian vs Immigrants from Morocco Professional Degree
COMPARE
Scandinavian
Immigrants from Morocco
Professional Degree
Professional Degree Comparison
Scandinavians
Immigrants from Morocco
4.2%
PROFESSIONAL DEGREE
25.8/ 100
METRIC RATING
194th/ 347
METRIC RANK
5.0%
PROFESSIONAL DEGREE
96.8/ 100
METRIC RATING
114th/ 347
METRIC RANK
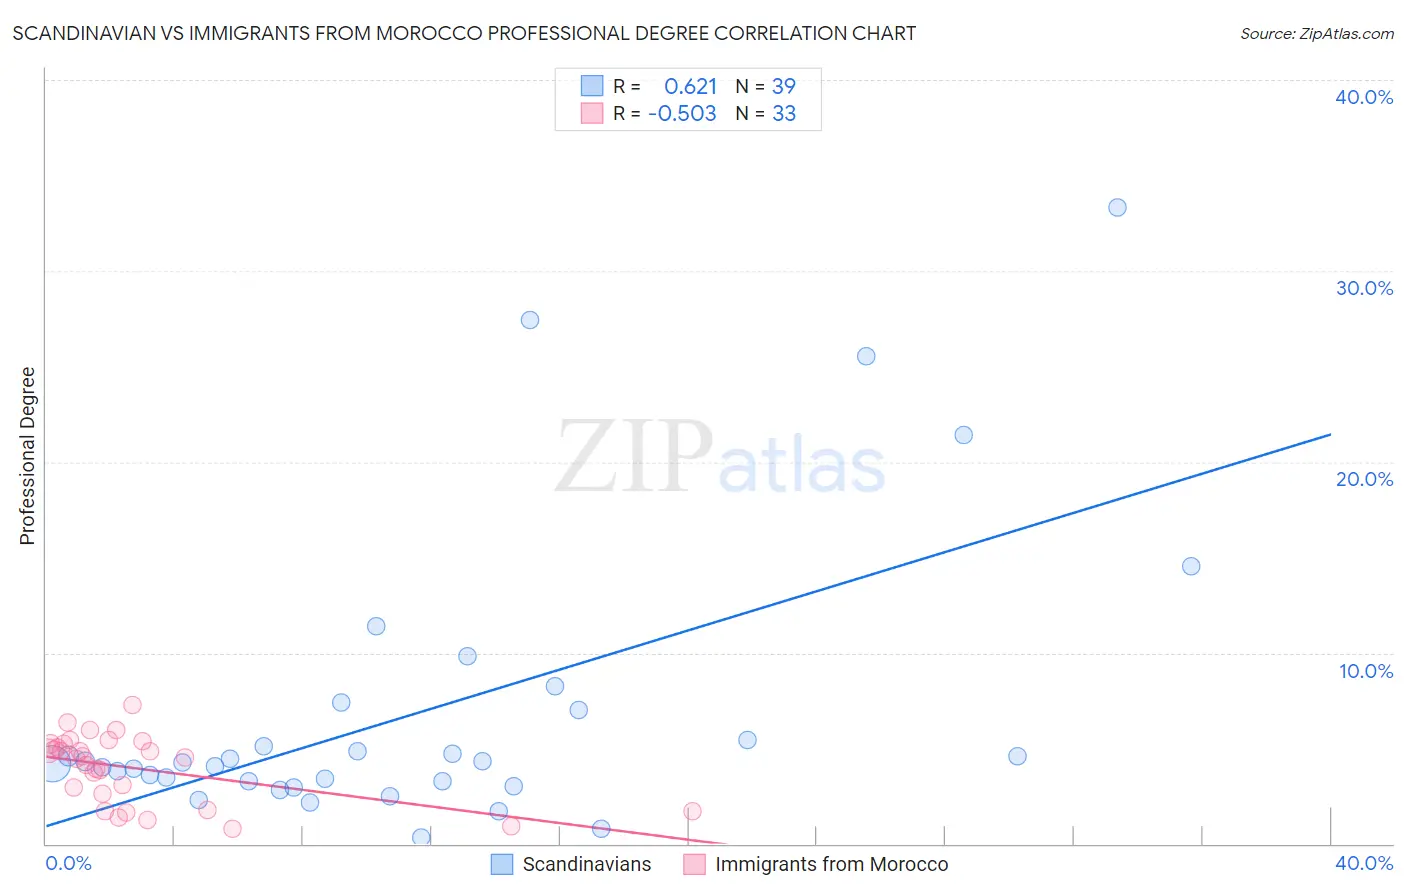
Scandinavian vs Immigrants from Morocco Professional Degree Correlation Chart
The statistical analysis conducted on geographies consisting of 469,840,840 people shows a significant positive correlation between the proportion of Scandinavians and percentage of population with at least professional degree education in the United States with a correlation coefficient (R) of 0.621 and weighted average of 4.2%. Similarly, the statistical analysis conducted on geographies consisting of 178,862,837 people shows a substantial negative correlation between the proportion of Immigrants from Morocco and percentage of population with at least professional degree education in the United States with a correlation coefficient (R) of -0.503 and weighted average of 5.0%, a difference of 16.9%.
Professional Degree Correlation Summary
| Measurement | Scandinavian | Immigrants from Morocco |
| Minimum | 0.33% | 0.78% |
| Maximum | 33.3% | 7.2% |
| Range | 33.0% | 6.4% |
| Mean | 6.9% | 4.0% |
| Median | 4.2% | 4.5% |
| Interquartile 25% (IQ1) | 3.3% | 2.2% |
| Interquartile 75% (IQ3) | 7.0% | 5.2% |
| Interquartile Range (IQR) | 3.8% | 3.0% |
| Standard Deviation (Sample) | 7.5% | 1.8% |
| Standard Deviation (Population) | 7.4% | 1.7% |
Similar Demographics by Professional Degree
Demographics Similar to Scandinavians by Professional Degree
In terms of professional degree, the demographic groups most similar to Scandinavians are Nigerian (4.2%, a difference of 0.24%), French (4.2%, a difference of 0.25%), Ghanaian (4.3%, a difference of 0.29%), Spanish (4.2%, a difference of 0.57%), and Sri Lankan (4.3%, a difference of 0.62%).
| Demographics | Rating | Rank | Professional Degree |
| Immigrants | Cameroon | 33.3 /100 | #187 | Fair 4.3% |
| Immigrants | Thailand | 31.7 /100 | #188 | Fair 4.3% |
| Slovaks | 30.7 /100 | #189 | Fair 4.3% |
| Immigrants | Poland | 29.2 /100 | #190 | Fair 4.3% |
| Sri Lankans | 29.0 /100 | #191 | Fair 4.3% |
| Ghanaians | 27.3 /100 | #192 | Fair 4.3% |
| French | 27.1 /100 | #193 | Fair 4.2% |
| Scandinavians | 25.8 /100 | #194 | Fair 4.2% |
| Nigerians | 24.6 /100 | #195 | Fair 4.2% |
| Spanish | 23.0 /100 | #196 | Fair 4.2% |
| Czechoslovakians | 22.4 /100 | #197 | Fair 4.2% |
| Immigrants | Middle Africa | 22.1 /100 | #198 | Fair 4.2% |
| Norwegians | 20.5 /100 | #199 | Fair 4.2% |
| Immigrants | North Macedonia | 20.2 /100 | #200 | Fair 4.2% |
| Finns | 18.7 /100 | #201 | Poor 4.2% |
Demographics Similar to Immigrants from Morocco by Professional Degree
In terms of professional degree, the demographic groups most similar to Immigrants from Morocco are Moroccan (5.0%, a difference of 0.10%), Immigrants from Pakistan (5.0%, a difference of 0.45%), Taiwanese (5.0%, a difference of 0.47%), Venezuelan (4.9%, a difference of 0.57%), and Brazilian (5.0%, a difference of 0.69%).
| Demographics | Rating | Rank | Professional Degree |
| Maltese | 98.1 /100 | #107 | Exceptional 5.0% |
| Immigrants | Southern Europe | 98.1 /100 | #108 | Exceptional 5.0% |
| British | 98.0 /100 | #109 | Exceptional 5.0% |
| Lebanese | 98.0 /100 | #110 | Exceptional 5.0% |
| Brazilians | 97.4 /100 | #111 | Exceptional 5.0% |
| Taiwanese | 97.3 /100 | #112 | Exceptional 5.0% |
| Immigrants | Pakistan | 97.2 /100 | #113 | Exceptional 5.0% |
| Immigrants | Morocco | 96.8 /100 | #114 | Exceptional 5.0% |
| Moroccans | 96.8 /100 | #115 | Exceptional 5.0% |
| Venezuelans | 96.3 /100 | #116 | Exceptional 4.9% |
| Immigrants | Syria | 96.0 /100 | #117 | Exceptional 4.9% |
| Croatians | 96.0 /100 | #118 | Exceptional 4.9% |
| Immigrants | Sudan | 95.4 /100 | #119 | Exceptional 4.9% |
| Albanians | 95.3 /100 | #120 | Exceptional 4.9% |
| Immigrants | Moldova | 94.8 /100 | #121 | Exceptional 4.9% |