Scandinavian vs Immigrants from Singapore Female Disability
COMPARE
Scandinavian
Immigrants from Singapore
Female Disability
Female Disability Comparison
Scandinavians
Immigrants from Singapore
12.5%
FEMALE DISABILITY
5.3/ 100
METRIC RATING
234th/ 347
METRIC RANK
10.4%
FEMALE DISABILITY
100.0/ 100
METRIC RATING
7th/ 347
METRIC RANK
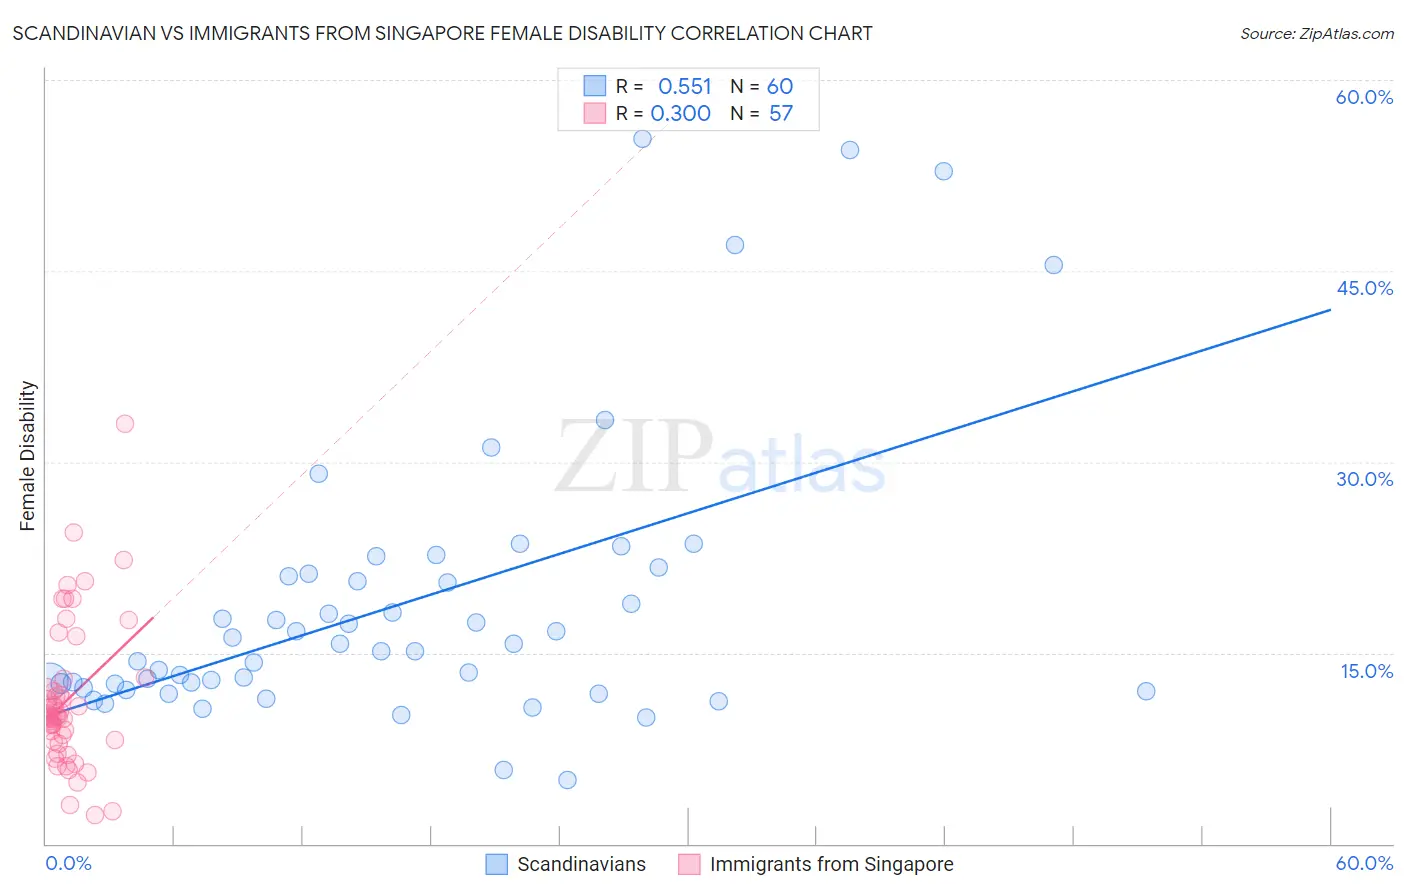
Scandinavian vs Immigrants from Singapore Female Disability Correlation Chart
The statistical analysis conducted on geographies consisting of 472,506,229 people shows a substantial positive correlation between the proportion of Scandinavians and percentage of females with a disability in the United States with a correlation coefficient (R) of 0.551 and weighted average of 12.5%. Similarly, the statistical analysis conducted on geographies consisting of 137,521,534 people shows a weak positive correlation between the proportion of Immigrants from Singapore and percentage of females with a disability in the United States with a correlation coefficient (R) of 0.300 and weighted average of 10.4%, a difference of 20.1%.
Female Disability Correlation Summary
| Measurement | Scandinavian | Immigrants from Singapore |
| Minimum | 5.0% | 2.2% |
| Maximum | 55.4% | 33.0% |
| Range | 50.4% | 30.8% |
| Mean | 18.9% | 11.4% |
| Median | 15.4% | 10.0% |
| Interquartile 25% (IQ1) | 12.4% | 8.1% |
| Interquartile 75% (IQ3) | 21.1% | 12.6% |
| Interquartile Range (IQR) | 8.7% | 4.4% |
| Standard Deviation (Sample) | 11.3% | 5.7% |
| Standard Deviation (Population) | 11.2% | 5.6% |
Similar Demographics by Female Disability
Demographics Similar to Scandinavians by Female Disability
In terms of female disability, the demographic groups most similar to Scandinavians are Immigrants from Iraq (12.5%, a difference of 0.010%), Malaysian (12.5%, a difference of 0.050%), Immigrants from Somalia (12.5%, a difference of 0.11%), Immigrants from West Indies (12.6%, a difference of 0.18%), and Belgian (12.5%, a difference of 0.20%).
| Demographics | Rating | Rank | Female Disability |
| Assyrians/Chaldeans/Syriacs | 8.0 /100 | #227 | Tragic 12.5% |
| Immigrants | Cambodia | 7.8 /100 | #228 | Tragic 12.5% |
| Hungarians | 7.2 /100 | #229 | Tragic 12.5% |
| Immigrants | Belize | 7.0 /100 | #230 | Tragic 12.5% |
| Belgians | 6.5 /100 | #231 | Tragic 12.5% |
| Immigrants | Somalia | 5.9 /100 | #232 | Tragic 12.5% |
| Immigrants | Iraq | 5.3 /100 | #233 | Tragic 12.5% |
| Scandinavians | 5.3 /100 | #234 | Tragic 12.5% |
| Malaysians | 5.0 /100 | #235 | Tragic 12.5% |
| Immigrants | West Indies | 4.4 /100 | #236 | Tragic 12.6% |
| Slavs | 3.8 /100 | #237 | Tragic 12.6% |
| Yugoslavians | 3.7 /100 | #238 | Tragic 12.6% |
| Barbadians | 3.6 /100 | #239 | Tragic 12.6% |
| German Russians | 3.2 /100 | #240 | Tragic 12.6% |
| Japanese | 2.7 /100 | #241 | Tragic 12.6% |
Demographics Similar to Immigrants from Singapore by Female Disability
In terms of female disability, the demographic groups most similar to Immigrants from Singapore are Immigrants from South Central Asia (10.5%, a difference of 0.22%), Bolivian (10.4%, a difference of 0.78%), Iranian (10.6%, a difference of 1.1%), Immigrants from Bolivia (10.3%, a difference of 1.7%), and Immigrants from Hong Kong (10.6%, a difference of 1.8%).
| Demographics | Rating | Rank | Female Disability |
| Immigrants | India | 100.0 /100 | #1 | Exceptional 10.0% |
| Filipinos | 100.0 /100 | #2 | Exceptional 10.1% |
| Immigrants | Taiwan | 100.0 /100 | #3 | Exceptional 10.1% |
| Thais | 100.0 /100 | #4 | Exceptional 10.2% |
| Immigrants | Bolivia | 100.0 /100 | #5 | Exceptional 10.3% |
| Bolivians | 100.0 /100 | #6 | Exceptional 10.4% |
| Immigrants | Singapore | 100.0 /100 | #7 | Exceptional 10.4% |
| Immigrants | South Central Asia | 100.0 /100 | #8 | Exceptional 10.5% |
| Iranians | 100.0 /100 | #9 | Exceptional 10.6% |
| Immigrants | Hong Kong | 100.0 /100 | #10 | Exceptional 10.6% |
| Immigrants | Korea | 100.0 /100 | #11 | Exceptional 10.6% |
| Immigrants | Israel | 100.0 /100 | #12 | Exceptional 10.7% |
| Immigrants | Eastern Asia | 100.0 /100 | #13 | Exceptional 10.7% |
| Immigrants | China | 100.0 /100 | #14 | Exceptional 10.7% |
| Burmese | 100.0 /100 | #15 | Exceptional 10.7% |