Apache vs Immigrants from Morocco Female Disability
COMPARE
Apache
Immigrants from Morocco
Female Disability
Female Disability Comparison
Apache
Immigrants from Morocco
13.7%
FEMALE DISABILITY
0.0/ 100
METRIC RATING
310th/ 347
METRIC RANK
11.8%
FEMALE DISABILITY
97.6/ 100
METRIC RATING
116th/ 347
METRIC RANK
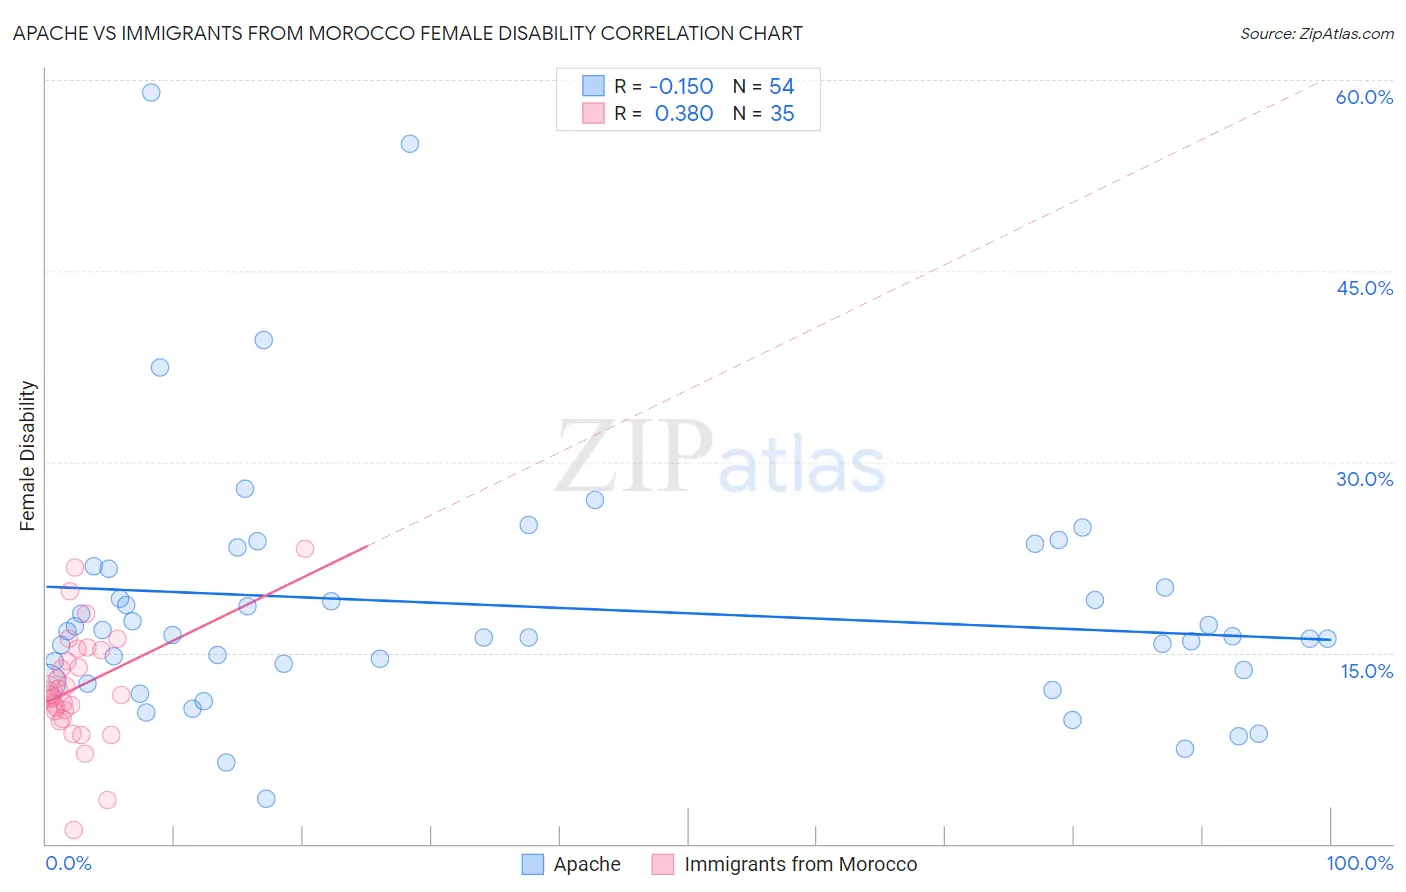
Apache vs Immigrants from Morocco Female Disability Correlation Chart
The statistical analysis conducted on geographies consisting of 231,061,138 people shows a poor negative correlation between the proportion of Apache and percentage of females with a disability in the United States with a correlation coefficient (R) of -0.150 and weighted average of 13.7%. Similarly, the statistical analysis conducted on geographies consisting of 178,909,163 people shows a mild positive correlation between the proportion of Immigrants from Morocco and percentage of females with a disability in the United States with a correlation coefficient (R) of 0.380 and weighted average of 11.8%, a difference of 16.5%.
Female Disability Correlation Summary
| Measurement | Apache | Immigrants from Morocco |
| Minimum | 3.6% | 1.0% |
| Maximum | 59.0% | 23.2% |
| Range | 55.5% | 22.1% |
| Mean | 18.7% | 12.3% |
| Median | 16.3% | 11.7% |
| Interquartile 25% (IQ1) | 13.7% | 10.4% |
| Interquartile 75% (IQ3) | 21.6% | 15.3% |
| Interquartile Range (IQR) | 7.9% | 4.8% |
| Standard Deviation (Sample) | 10.1% | 4.4% |
| Standard Deviation (Population) | 10.0% | 4.4% |
Similar Demographics by Female Disability
Demographics Similar to Apache by Female Disability
In terms of female disability, the demographic groups most similar to Apache are French American Indian (13.7%, a difference of 0.12%), Cree (13.7%, a difference of 0.18%), Hopi (13.7%, a difference of 0.29%), Delaware (13.8%, a difference of 0.60%), and Central American Indian (13.6%, a difference of 0.63%).
| Demographics | Rating | Rank | Female Disability |
| Immigrants | Portugal | 0.0 /100 | #303 | Tragic 13.5% |
| Immigrants | Micronesia | 0.0 /100 | #304 | Tragic 13.5% |
| Dominicans | 0.0 /100 | #305 | Tragic 13.5% |
| French Canadians | 0.0 /100 | #306 | Tragic 13.6% |
| Central American Indians | 0.0 /100 | #307 | Tragic 13.6% |
| Cree | 0.0 /100 | #308 | Tragic 13.7% |
| French American Indians | 0.0 /100 | #309 | Tragic 13.7% |
| Apache | 0.0 /100 | #310 | Tragic 13.7% |
| Hopi | 0.0 /100 | #311 | Tragic 13.7% |
| Delaware | 0.0 /100 | #312 | Tragic 13.8% |
| Blackfeet | 0.0 /100 | #313 | Tragic 13.8% |
| Puget Sound Salish | 0.0 /100 | #314 | Tragic 13.8% |
| Alaskan Athabascans | 0.0 /100 | #315 | Tragic 13.9% |
| Spanish Americans | 0.0 /100 | #316 | Tragic 14.0% |
| Chippewa | 0.0 /100 | #317 | Tragic 14.0% |
Demographics Similar to Immigrants from Morocco by Female Disability
In terms of female disability, the demographic groups most similar to Immigrants from Morocco are Brazilian (11.8%, a difference of 0.040%), South African (11.8%, a difference of 0.050%), Immigrants from Belarus (11.8%, a difference of 0.070%), Immigrants from Bangladesh (11.8%, a difference of 0.090%), and Immigrants from Eastern Europe (11.8%, a difference of 0.15%).
| Demographics | Rating | Rank | Female Disability |
| Immigrants | Immigrants | 98.1 /100 | #109 | Exceptional 11.7% |
| Soviet Union | 98.1 /100 | #110 | Exceptional 11.7% |
| Costa Ricans | 98.1 /100 | #111 | Exceptional 11.7% |
| Immigrants | Bangladesh | 97.8 /100 | #112 | Exceptional 11.8% |
| Immigrants | Belarus | 97.8 /100 | #113 | Exceptional 11.8% |
| South Africans | 97.7 /100 | #114 | Exceptional 11.8% |
| Brazilians | 97.7 /100 | #115 | Exceptional 11.8% |
| Immigrants | Morocco | 97.6 /100 | #116 | Exceptional 11.8% |
| Immigrants | Eastern Europe | 97.2 /100 | #117 | Exceptional 11.8% |
| Immigrants | Nigeria | 97.2 /100 | #118 | Exceptional 11.8% |
| Immigrants | Uganda | 97.2 /100 | #119 | Exceptional 11.8% |
| Immigrants | Kazakhstan | 97.0 /100 | #120 | Exceptional 11.8% |
| Immigrants | Netherlands | 96.9 /100 | #121 | Exceptional 11.8% |
| Immigrants | North Macedonia | 96.8 /100 | #122 | Exceptional 11.8% |
| Immigrants | Croatia | 96.7 /100 | #123 | Exceptional 11.8% |