Scandinavian vs Immigrants from Dominica Female Disability
COMPARE
Scandinavian
Immigrants from Dominica
Female Disability
Female Disability Comparison
Scandinavians
Immigrants from Dominica
12.5%
FEMALE DISABILITY
5.3/ 100
METRIC RATING
234th/ 347
METRIC RANK
13.0%
FEMALE DISABILITY
0.1/ 100
METRIC RATING
276th/ 347
METRIC RANK
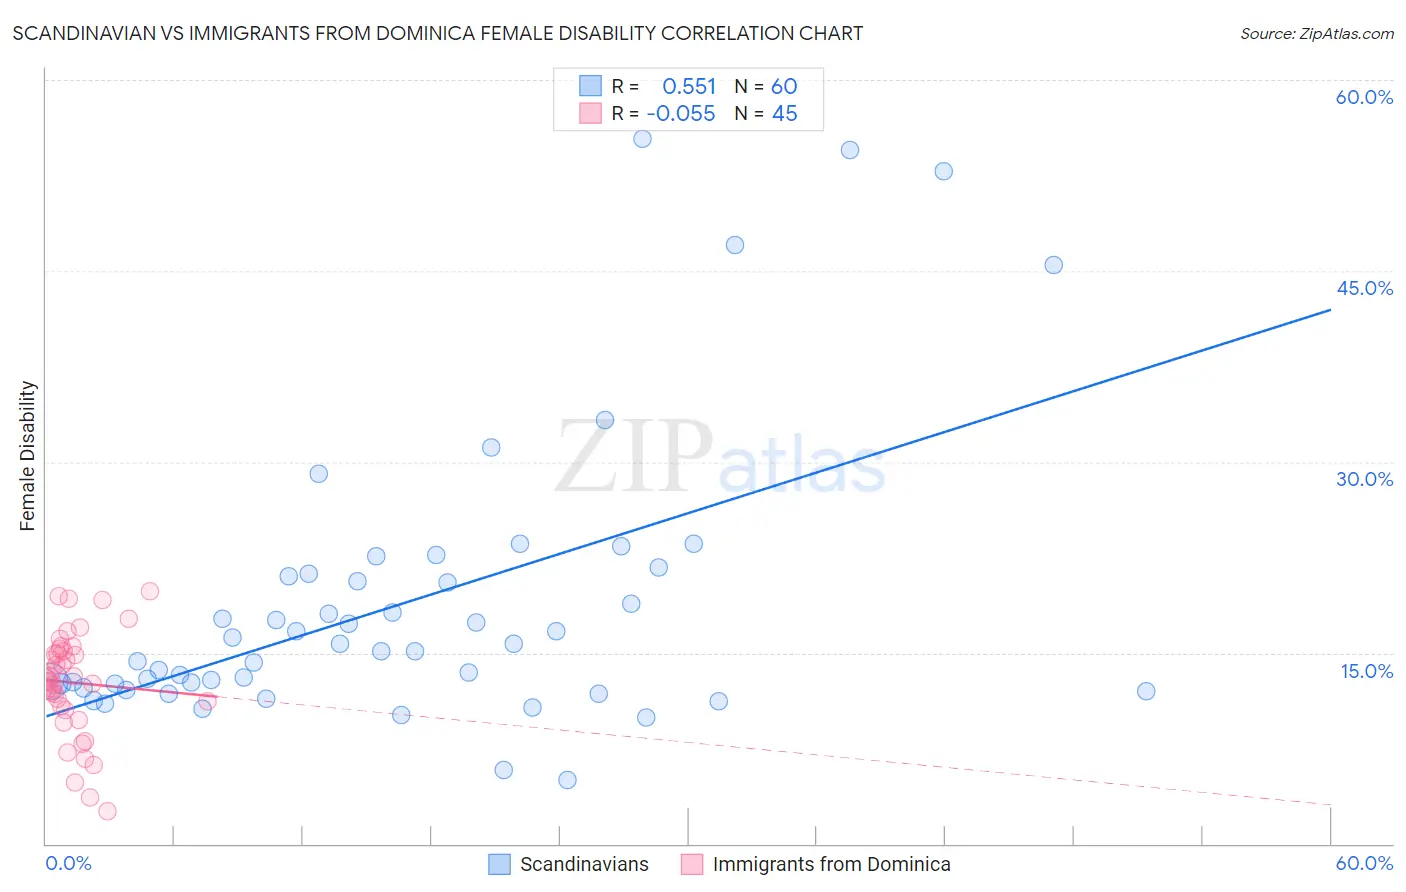
Scandinavian vs Immigrants from Dominica Female Disability Correlation Chart
The statistical analysis conducted on geographies consisting of 472,506,229 people shows a substantial positive correlation between the proportion of Scandinavians and percentage of females with a disability in the United States with a correlation coefficient (R) of 0.551 and weighted average of 12.5%. Similarly, the statistical analysis conducted on geographies consisting of 83,793,109 people shows a slight negative correlation between the proportion of Immigrants from Dominica and percentage of females with a disability in the United States with a correlation coefficient (R) of -0.055 and weighted average of 13.0%, a difference of 3.6%.
Female Disability Correlation Summary
| Measurement | Scandinavian | Immigrants from Dominica |
| Minimum | 5.0% | 2.5% |
| Maximum | 55.4% | 19.9% |
| Range | 50.4% | 17.3% |
| Mean | 18.9% | 12.7% |
| Median | 15.4% | 13.0% |
| Interquartile 25% (IQ1) | 12.4% | 10.6% |
| Interquartile 75% (IQ3) | 21.1% | 15.2% |
| Interquartile Range (IQR) | 8.7% | 4.5% |
| Standard Deviation (Sample) | 11.3% | 4.1% |
| Standard Deviation (Population) | 11.2% | 4.1% |
Similar Demographics by Female Disability
Demographics Similar to Scandinavians by Female Disability
In terms of female disability, the demographic groups most similar to Scandinavians are Immigrants from Iraq (12.5%, a difference of 0.010%), Malaysian (12.5%, a difference of 0.050%), Immigrants from Somalia (12.5%, a difference of 0.11%), Immigrants from West Indies (12.6%, a difference of 0.18%), and Belgian (12.5%, a difference of 0.20%).
| Demographics | Rating | Rank | Female Disability |
| Assyrians/Chaldeans/Syriacs | 8.0 /100 | #227 | Tragic 12.5% |
| Immigrants | Cambodia | 7.8 /100 | #228 | Tragic 12.5% |
| Hungarians | 7.2 /100 | #229 | Tragic 12.5% |
| Immigrants | Belize | 7.0 /100 | #230 | Tragic 12.5% |
| Belgians | 6.5 /100 | #231 | Tragic 12.5% |
| Immigrants | Somalia | 5.9 /100 | #232 | Tragic 12.5% |
| Immigrants | Iraq | 5.3 /100 | #233 | Tragic 12.5% |
| Scandinavians | 5.3 /100 | #234 | Tragic 12.5% |
| Malaysians | 5.0 /100 | #235 | Tragic 12.5% |
| Immigrants | West Indies | 4.4 /100 | #236 | Tragic 12.6% |
| Slavs | 3.8 /100 | #237 | Tragic 12.6% |
| Yugoslavians | 3.7 /100 | #238 | Tragic 12.6% |
| Barbadians | 3.6 /100 | #239 | Tragic 12.6% |
| German Russians | 3.2 /100 | #240 | Tragic 12.6% |
| Japanese | 2.7 /100 | #241 | Tragic 12.6% |
Demographics Similar to Immigrants from Dominica by Female Disability
In terms of female disability, the demographic groups most similar to Immigrants from Dominica are Cheyenne (13.0%, a difference of 0.050%), Portuguese (13.0%, a difference of 0.10%), Spanish (13.0%, a difference of 0.20%), Sioux (12.9%, a difference of 0.22%), and German (12.9%, a difference of 0.24%).
| Demographics | Rating | Rank | Female Disability |
| Indonesians | 0.4 /100 | #269 | Tragic 12.8% |
| Immigrants | Liberia | 0.3 /100 | #270 | Tragic 12.9% |
| Dutch | 0.2 /100 | #271 | Tragic 12.9% |
| Germans | 0.1 /100 | #272 | Tragic 12.9% |
| Sioux | 0.1 /100 | #273 | Tragic 12.9% |
| Portuguese | 0.1 /100 | #274 | Tragic 13.0% |
| Cheyenne | 0.1 /100 | #275 | Tragic 13.0% |
| Immigrants | Dominica | 0.1 /100 | #276 | Tragic 13.0% |
| Spanish | 0.1 /100 | #277 | Tragic 13.0% |
| Scottish | 0.1 /100 | #278 | Tragic 13.0% |
| Arapaho | 0.1 /100 | #279 | Tragic 13.0% |
| Irish | 0.1 /100 | #280 | Tragic 13.1% |
| U.S. Virgin Islanders | 0.1 /100 | #281 | Tragic 13.1% |
| Welsh | 0.0 /100 | #282 | Tragic 13.1% |
| English | 0.0 /100 | #283 | Tragic 13.1% |