Colville vs Immigrants from Morocco Female Disability
COMPARE
Colville
Immigrants from Morocco
Female Disability
Female Disability Comparison
Colville
Immigrants from Morocco
15.1%
FEMALE DISABILITY
0.0/ 100
METRIC RATING
339th/ 347
METRIC RANK
11.8%
FEMALE DISABILITY
97.6/ 100
METRIC RATING
116th/ 347
METRIC RANK
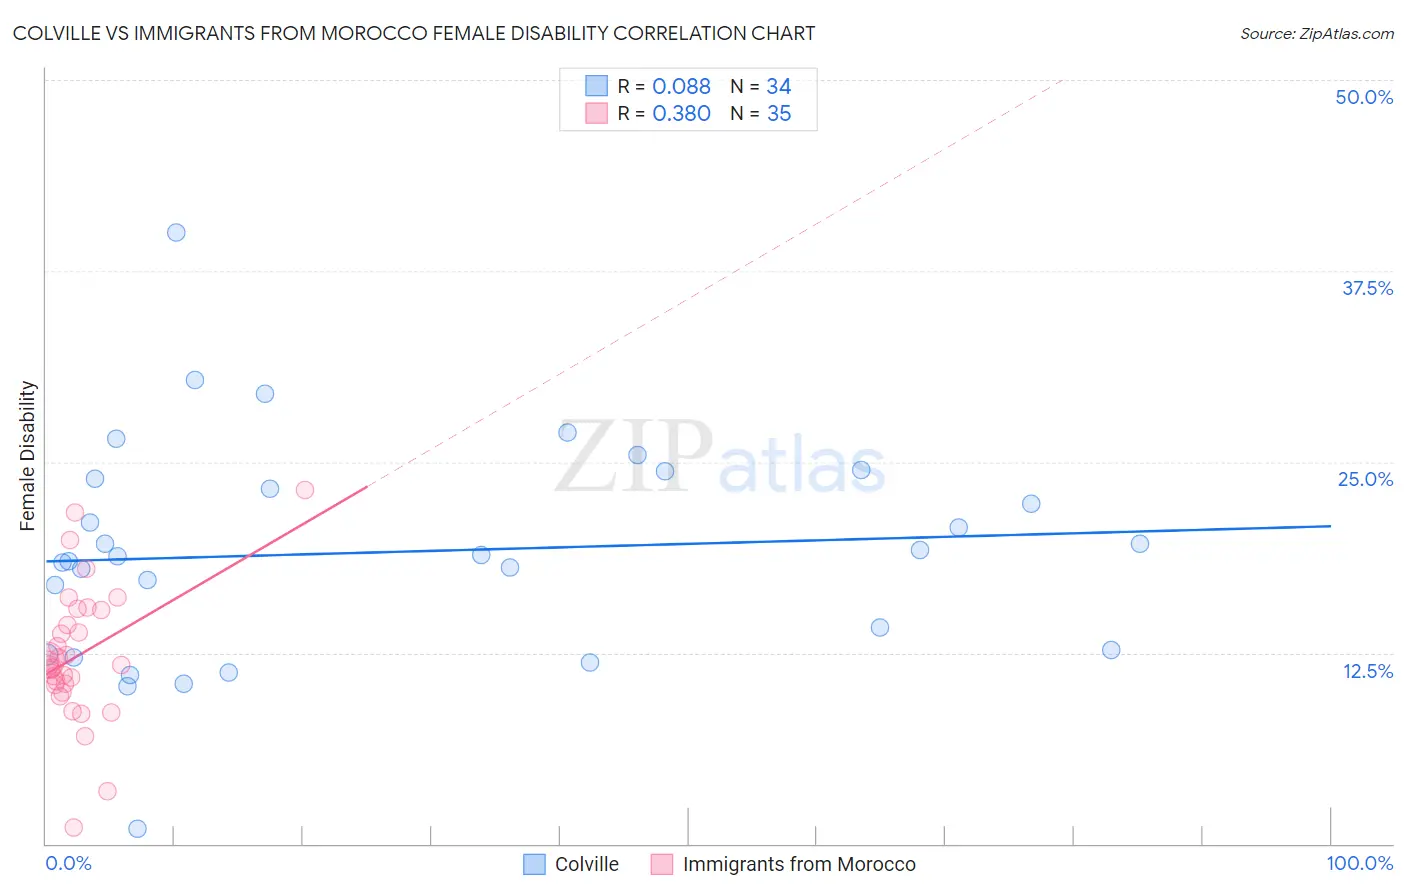
Colville vs Immigrants from Morocco Female Disability Correlation Chart
The statistical analysis conducted on geographies consisting of 34,687,480 people shows a slight positive correlation between the proportion of Colville and percentage of females with a disability in the United States with a correlation coefficient (R) of 0.088 and weighted average of 15.1%. Similarly, the statistical analysis conducted on geographies consisting of 178,909,163 people shows a mild positive correlation between the proportion of Immigrants from Morocco and percentage of females with a disability in the United States with a correlation coefficient (R) of 0.380 and weighted average of 11.8%, a difference of 28.0%.
Female Disability Correlation Summary
| Measurement | Colville | Immigrants from Morocco |
| Minimum | 0.95% | 1.0% |
| Maximum | 40.0% | 23.2% |
| Range | 39.1% | 22.1% |
| Mean | 19.1% | 12.3% |
| Median | 18.9% | 11.7% |
| Interquartile 25% (IQ1) | 12.7% | 10.4% |
| Interquartile 75% (IQ3) | 23.9% | 15.3% |
| Interquartile Range (IQR) | 11.3% | 4.8% |
| Standard Deviation (Sample) | 7.3% | 4.4% |
| Standard Deviation (Population) | 7.2% | 4.4% |
Similar Demographics by Female Disability
Demographics Similar to Colville by Female Disability
In terms of female disability, the demographic groups most similar to Colville are Dutch West Indian (15.0%, a difference of 0.40%), Tohono O'odham (15.0%, a difference of 0.55%), Seminole (15.0%, a difference of 0.67%), Chickasaw (15.2%, a difference of 0.95%), and Cajun (14.9%, a difference of 1.3%).
| Demographics | Rating | Rank | Female Disability |
| Pima | 0.0 /100 | #332 | Tragic 14.8% |
| Immigrants | Azores | 0.0 /100 | #333 | Tragic 14.9% |
| Cherokee | 0.0 /100 | #334 | Tragic 14.9% |
| Cajuns | 0.0 /100 | #335 | Tragic 14.9% |
| Seminole | 0.0 /100 | #336 | Tragic 15.0% |
| Tohono O'odham | 0.0 /100 | #337 | Tragic 15.0% |
| Dutch West Indians | 0.0 /100 | #338 | Tragic 15.0% |
| Colville | 0.0 /100 | #339 | Tragic 15.1% |
| Chickasaw | 0.0 /100 | #340 | Tragic 15.2% |
| Choctaw | 0.0 /100 | #341 | Tragic 15.4% |
| Creek | 0.0 /100 | #342 | Tragic 15.7% |
| Lumbee | 0.0 /100 | #343 | Tragic 15.8% |
| Kiowa | 0.0 /100 | #344 | Tragic 15.8% |
| Puerto Ricans | 0.0 /100 | #345 | Tragic 16.6% |
| Tsimshian | 0.0 /100 | #346 | Tragic 16.8% |
Demographics Similar to Immigrants from Morocco by Female Disability
In terms of female disability, the demographic groups most similar to Immigrants from Morocco are Brazilian (11.8%, a difference of 0.040%), South African (11.8%, a difference of 0.050%), Immigrants from Belarus (11.8%, a difference of 0.070%), Immigrants from Bangladesh (11.8%, a difference of 0.090%), and Immigrants from Eastern Europe (11.8%, a difference of 0.15%).
| Demographics | Rating | Rank | Female Disability |
| Immigrants | Immigrants | 98.1 /100 | #109 | Exceptional 11.7% |
| Soviet Union | 98.1 /100 | #110 | Exceptional 11.7% |
| Costa Ricans | 98.1 /100 | #111 | Exceptional 11.7% |
| Immigrants | Bangladesh | 97.8 /100 | #112 | Exceptional 11.8% |
| Immigrants | Belarus | 97.8 /100 | #113 | Exceptional 11.8% |
| South Africans | 97.7 /100 | #114 | Exceptional 11.8% |
| Brazilians | 97.7 /100 | #115 | Exceptional 11.8% |
| Immigrants | Morocco | 97.6 /100 | #116 | Exceptional 11.8% |
| Immigrants | Eastern Europe | 97.2 /100 | #117 | Exceptional 11.8% |
| Immigrants | Nigeria | 97.2 /100 | #118 | Exceptional 11.8% |
| Immigrants | Uganda | 97.2 /100 | #119 | Exceptional 11.8% |
| Immigrants | Kazakhstan | 97.0 /100 | #120 | Exceptional 11.8% |
| Immigrants | Netherlands | 96.9 /100 | #121 | Exceptional 11.8% |
| Immigrants | North Macedonia | 96.8 /100 | #122 | Exceptional 11.8% |
| Immigrants | Croatia | 96.7 /100 | #123 | Exceptional 11.8% |