Salvadoran vs Immigrants from Scotland Disability
COMPARE
Salvadoran
Immigrants from Scotland
Disability
Disability Comparison
Salvadorans
Immigrants from Scotland
10.9%
DISABILITY
99.8/ 100
METRIC RATING
57th/ 347
METRIC RANK
11.8%
DISABILITY
28.2/ 100
METRIC RATING
186th/ 347
METRIC RANK
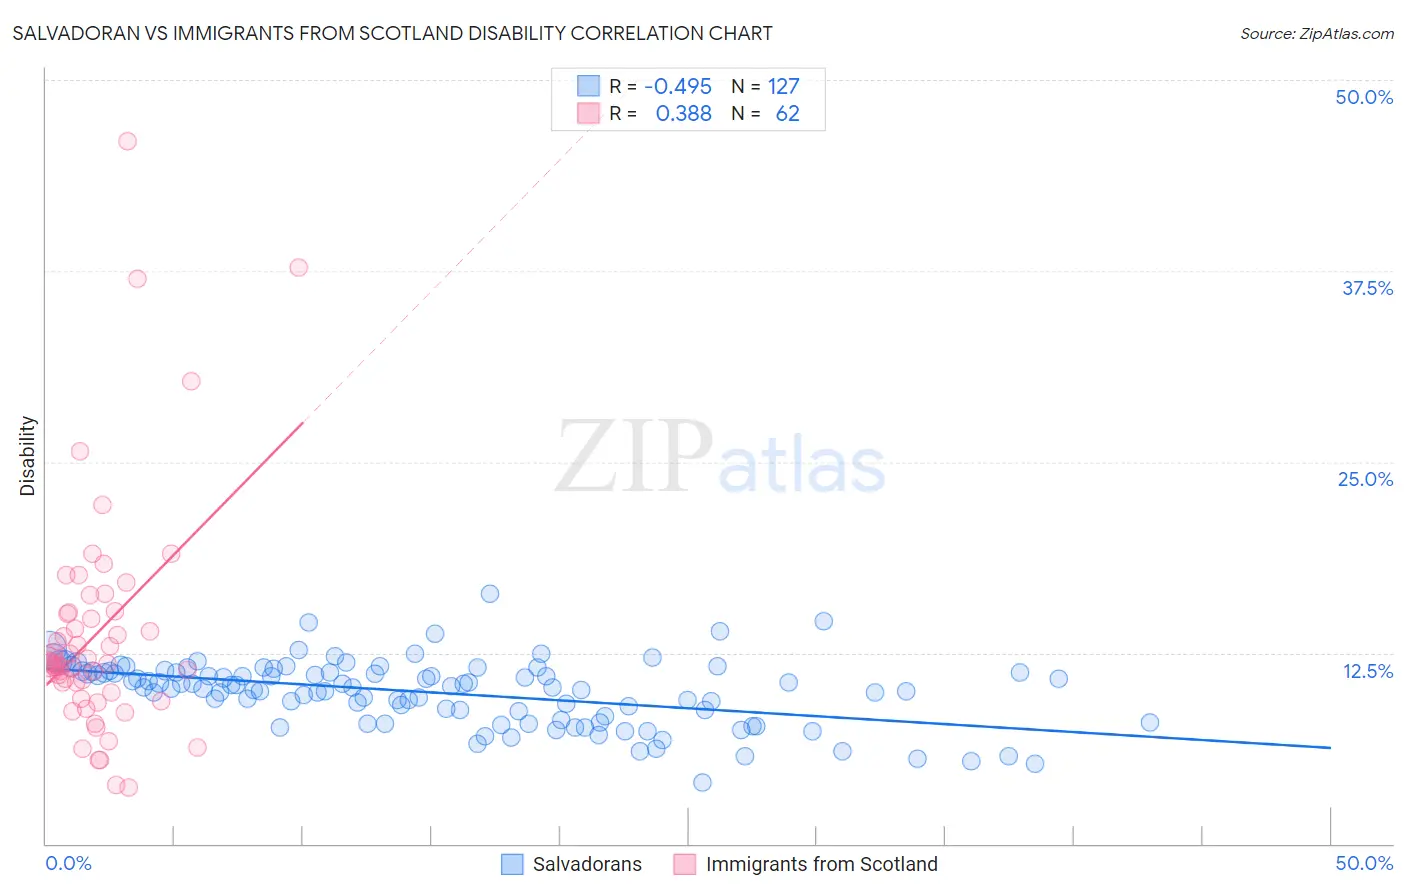
Salvadoran vs Immigrants from Scotland Disability Correlation Chart
The statistical analysis conducted on geographies consisting of 398,952,177 people shows a moderate negative correlation between the proportion of Salvadorans and percentage of population with a disability in the United States with a correlation coefficient (R) of -0.495 and weighted average of 10.9%. Similarly, the statistical analysis conducted on geographies consisting of 196,399,037 people shows a mild positive correlation between the proportion of Immigrants from Scotland and percentage of population with a disability in the United States with a correlation coefficient (R) of 0.388 and weighted average of 11.8%, a difference of 8.3%.
Disability Correlation Summary
| Measurement | Salvadoran | Immigrants from Scotland |
| Minimum | 4.0% | 3.7% |
| Maximum | 16.3% | 46.0% |
| Range | 12.3% | 42.3% |
| Mean | 9.9% | 13.8% |
| Median | 10.3% | 11.8% |
| Interquartile 25% (IQ1) | 8.3% | 9.9% |
| Interquartile 75% (IQ3) | 11.3% | 15.1% |
| Interquartile Range (IQR) | 3.0% | 5.2% |
| Standard Deviation (Sample) | 2.1% | 7.7% |
| Standard Deviation (Population) | 2.1% | 7.6% |
Similar Demographics by Disability
Demographics Similar to Salvadorans by Disability
In terms of disability, the demographic groups most similar to Salvadorans are Immigrants from South America (10.9%, a difference of 0.030%), Immigrants from Colombia (10.9%, a difference of 0.12%), Zimbabwean (10.9%, a difference of 0.22%), Immigrants from Lithuania (10.9%, a difference of 0.24%), and Immigrants from Bulgaria (10.9%, a difference of 0.27%).
| Demographics | Rating | Rank | Disability |
| Immigrants | Saudi Arabia | 99.9 /100 | #50 | Exceptional 10.9% |
| Peruvians | 99.8 /100 | #51 | Exceptional 10.9% |
| South Americans | 99.8 /100 | #52 | Exceptional 10.9% |
| Immigrants | Spain | 99.8 /100 | #53 | Exceptional 10.9% |
| Jordanians | 99.8 /100 | #54 | Exceptional 10.9% |
| Immigrants | El Salvador | 99.8 /100 | #55 | Exceptional 10.9% |
| Immigrants | Lithuania | 99.8 /100 | #56 | Exceptional 10.9% |
| Salvadorans | 99.8 /100 | #57 | Exceptional 10.9% |
| Immigrants | South America | 99.8 /100 | #58 | Exceptional 10.9% |
| Immigrants | Colombia | 99.7 /100 | #59 | Exceptional 10.9% |
| Zimbabweans | 99.7 /100 | #60 | Exceptional 10.9% |
| Immigrants | Bulgaria | 99.7 /100 | #61 | Exceptional 10.9% |
| Immigrants | Northern Africa | 99.7 /100 | #62 | Exceptional 10.9% |
| Immigrants | Eritrea | 99.7 /100 | #63 | Exceptional 11.0% |
| Immigrants | Sweden | 99.6 /100 | #64 | Exceptional 11.0% |
Demographics Similar to Immigrants from Scotland by Disability
In terms of disability, the demographic groups most similar to Immigrants from Scotland are Immigrants from Burma/Myanmar (11.8%, a difference of 0.010%), Lebanese (11.8%, a difference of 0.020%), Iraqi (11.8%, a difference of 0.090%), Honduran (11.8%, a difference of 0.16%), and Immigrants from Mexico (11.9%, a difference of 0.26%).
| Demographics | Rating | Rank | Disability |
| Immigrants | Armenia | 41.9 /100 | #179 | Average 11.7% |
| Immigrants | Honduras | 37.8 /100 | #180 | Fair 11.8% |
| Immigrants | Oceania | 34.3 /100 | #181 | Fair 11.8% |
| Icelanders | 34.0 /100 | #182 | Fair 11.8% |
| Hondurans | 31.2 /100 | #183 | Fair 11.8% |
| Iraqis | 30.0 /100 | #184 | Fair 11.8% |
| Immigrants | Burma/Myanmar | 28.5 /100 | #185 | Fair 11.8% |
| Immigrants | Scotland | 28.2 /100 | #186 | Fair 11.8% |
| Lebanese | 27.9 /100 | #187 | Fair 11.8% |
| Immigrants | Mexico | 23.8 /100 | #188 | Fair 11.9% |
| Immigrants | Zaire | 21.8 /100 | #189 | Fair 11.9% |
| Immigrants | West Indies | 21.1 /100 | #190 | Fair 11.9% |
| Ute | 19.5 /100 | #191 | Poor 11.9% |
| Lithuanians | 18.8 /100 | #192 | Poor 11.9% |
| Immigrants | Bosnia and Herzegovina | 18.0 /100 | #193 | Poor 11.9% |