Salvadoran vs Comanche Disability
COMPARE
Salvadoran
Comanche
Disability
Disability Comparison
Salvadorans
Comanche
10.9%
DISABILITY
99.8/ 100
METRIC RATING
57th/ 347
METRIC RANK
14.1%
DISABILITY
0.0/ 100
METRIC RATING
323rd/ 347
METRIC RANK
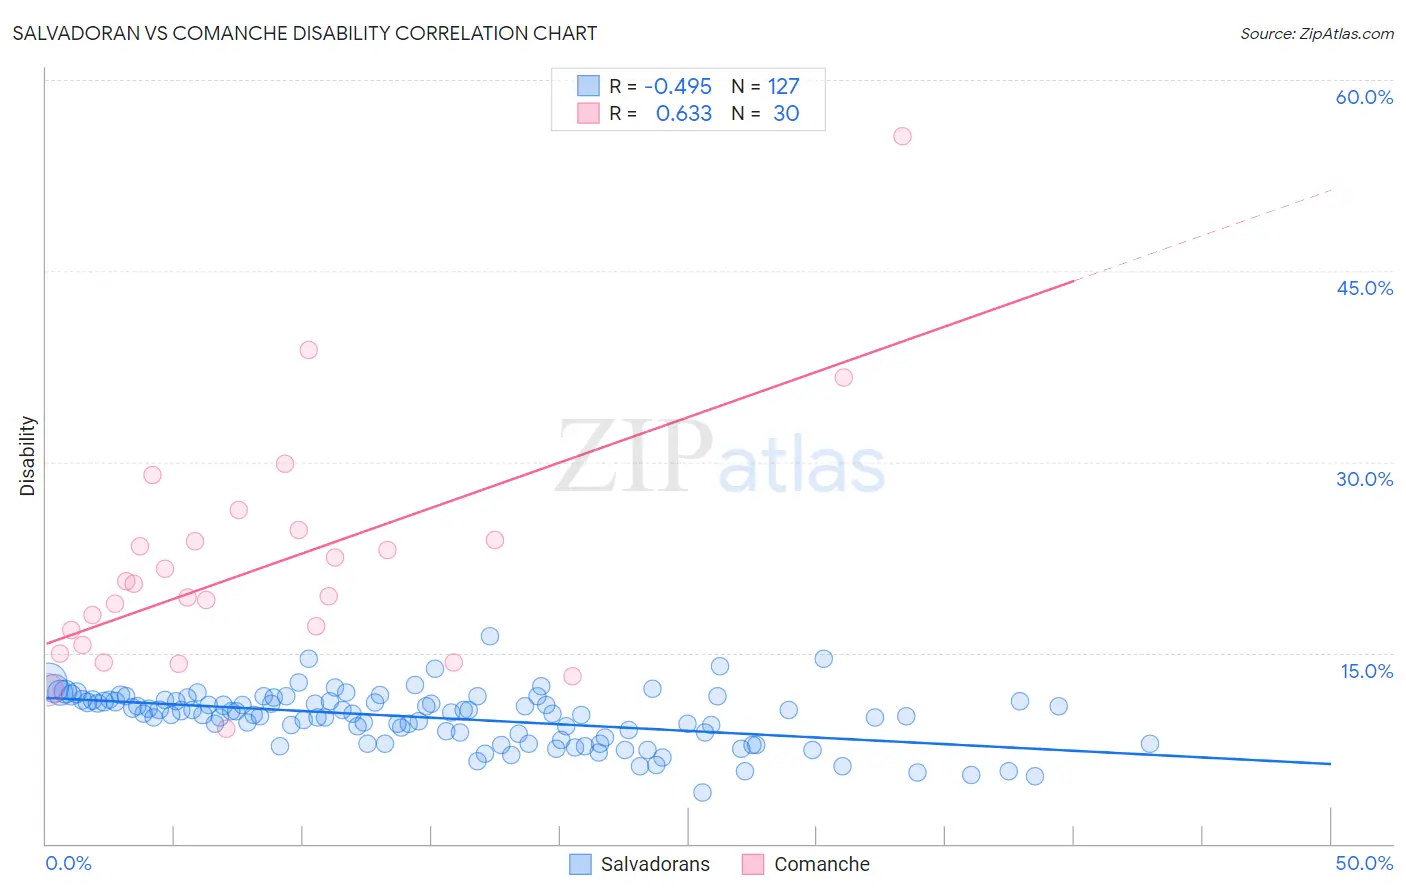
Salvadoran vs Comanche Disability Correlation Chart
The statistical analysis conducted on geographies consisting of 398,952,177 people shows a moderate negative correlation between the proportion of Salvadorans and percentage of population with a disability in the United States with a correlation coefficient (R) of -0.495 and weighted average of 10.9%. Similarly, the statistical analysis conducted on geographies consisting of 109,776,757 people shows a significant positive correlation between the proportion of Comanche and percentage of population with a disability in the United States with a correlation coefficient (R) of 0.633 and weighted average of 14.1%, a difference of 29.3%.
Disability Correlation Summary
| Measurement | Salvadoran | Comanche |
| Minimum | 4.0% | 9.0% |
| Maximum | 16.3% | 55.6% |
| Range | 12.3% | 46.5% |
| Mean | 9.9% | 21.9% |
| Median | 10.3% | 19.9% |
| Interquartile 25% (IQ1) | 8.3% | 15.6% |
| Interquartile 75% (IQ3) | 11.3% | 23.8% |
| Interquartile Range (IQR) | 3.0% | 8.3% |
| Standard Deviation (Sample) | 2.1% | 9.3% |
| Standard Deviation (Population) | 2.1% | 9.1% |
Similar Demographics by Disability
Demographics Similar to Salvadorans by Disability
In terms of disability, the demographic groups most similar to Salvadorans are Immigrants from South America (10.9%, a difference of 0.030%), Immigrants from Colombia (10.9%, a difference of 0.12%), Zimbabwean (10.9%, a difference of 0.22%), Immigrants from Lithuania (10.9%, a difference of 0.24%), and Immigrants from Bulgaria (10.9%, a difference of 0.27%).
| Demographics | Rating | Rank | Disability |
| Immigrants | Saudi Arabia | 99.9 /100 | #50 | Exceptional 10.9% |
| Peruvians | 99.8 /100 | #51 | Exceptional 10.9% |
| South Americans | 99.8 /100 | #52 | Exceptional 10.9% |
| Immigrants | Spain | 99.8 /100 | #53 | Exceptional 10.9% |
| Jordanians | 99.8 /100 | #54 | Exceptional 10.9% |
| Immigrants | El Salvador | 99.8 /100 | #55 | Exceptional 10.9% |
| Immigrants | Lithuania | 99.8 /100 | #56 | Exceptional 10.9% |
| Salvadorans | 99.8 /100 | #57 | Exceptional 10.9% |
| Immigrants | South America | 99.8 /100 | #58 | Exceptional 10.9% |
| Immigrants | Colombia | 99.7 /100 | #59 | Exceptional 10.9% |
| Zimbabweans | 99.7 /100 | #60 | Exceptional 10.9% |
| Immigrants | Bulgaria | 99.7 /100 | #61 | Exceptional 10.9% |
| Immigrants | Northern Africa | 99.7 /100 | #62 | Exceptional 10.9% |
| Immigrants | Eritrea | 99.7 /100 | #63 | Exceptional 11.0% |
| Immigrants | Sweden | 99.6 /100 | #64 | Exceptional 11.0% |
Demographics Similar to Comanche by Disability
In terms of disability, the demographic groups most similar to Comanche are Chippewa (14.1%, a difference of 0.20%), Native/Alaskan (14.2%, a difference of 0.25%), Osage (14.2%, a difference of 0.28%), Ottawa (14.2%, a difference of 0.30%), and Immigrants from the Azores (14.2%, a difference of 0.30%).
| Demographics | Rating | Rank | Disability |
| Pima | 0.0 /100 | #316 | Tragic 13.7% |
| Immigrants | Cabo Verde | 0.0 /100 | #317 | Tragic 13.7% |
| Menominee | 0.0 /100 | #318 | Tragic 13.8% |
| Iroquois | 0.0 /100 | #319 | Tragic 13.8% |
| Apache | 0.0 /100 | #320 | Tragic 13.9% |
| Paiute | 0.0 /100 | #321 | Tragic 13.9% |
| Americans | 0.0 /100 | #322 | Tragic 13.9% |
| Comanche | 0.0 /100 | #323 | Tragic 14.1% |
| Chippewa | 0.0 /100 | #324 | Tragic 14.1% |
| Natives/Alaskans | 0.0 /100 | #325 | Tragic 14.2% |
| Osage | 0.0 /100 | #326 | Tragic 14.2% |
| Ottawa | 0.0 /100 | #327 | Tragic 14.2% |
| Immigrants | Azores | 0.0 /100 | #328 | Tragic 14.2% |
| Potawatomi | 0.0 /100 | #329 | Tragic 14.2% |
| Navajo | 0.0 /100 | #330 | Tragic 14.3% |