Salvadoran vs Thai Disability
COMPARE
Salvadoran
Thai
Disability
Disability Comparison
Salvadorans
Thais
10.9%
DISABILITY
99.8/ 100
METRIC RATING
57th/ 347
METRIC RANK
9.7%
DISABILITY
100.0/ 100
METRIC RATING
4th/ 347
METRIC RANK
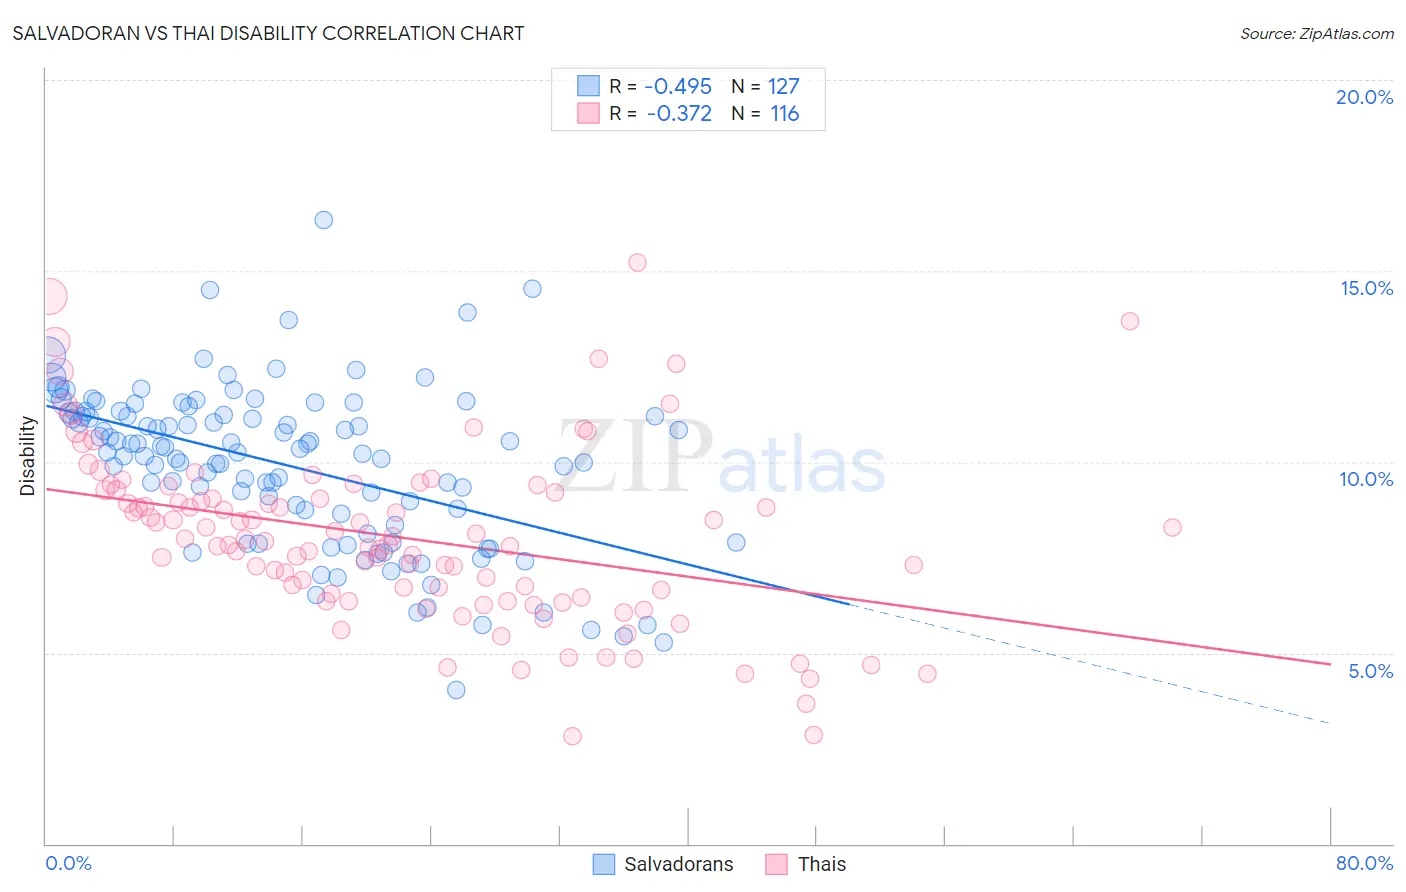
Salvadoran vs Thai Disability Correlation Chart
The statistical analysis conducted on geographies consisting of 398,952,177 people shows a moderate negative correlation between the proportion of Salvadorans and percentage of population with a disability in the United States with a correlation coefficient (R) of -0.495 and weighted average of 10.9%. Similarly, the statistical analysis conducted on geographies consisting of 475,831,416 people shows a mild negative correlation between the proportion of Thais and percentage of population with a disability in the United States with a correlation coefficient (R) of -0.372 and weighted average of 9.7%, a difference of 12.5%.
Disability Correlation Summary
| Measurement | Salvadoran | Thai |
| Minimum | 4.0% | 2.8% |
| Maximum | 16.3% | 15.2% |
| Range | 12.3% | 12.4% |
| Mean | 9.9% | 8.0% |
| Median | 10.3% | 7.9% |
| Interquartile 25% (IQ1) | 8.3% | 6.5% |
| Interquartile 75% (IQ3) | 11.3% | 9.2% |
| Interquartile Range (IQR) | 3.0% | 2.7% |
| Standard Deviation (Sample) | 2.1% | 2.3% |
| Standard Deviation (Population) | 2.1% | 2.3% |
Similar Demographics by Disability
Demographics Similar to Salvadorans by Disability
In terms of disability, the demographic groups most similar to Salvadorans are Immigrants from South America (10.9%, a difference of 0.030%), Immigrants from Colombia (10.9%, a difference of 0.12%), Zimbabwean (10.9%, a difference of 0.22%), Immigrants from Lithuania (10.9%, a difference of 0.24%), and Immigrants from Bulgaria (10.9%, a difference of 0.27%).
| Demographics | Rating | Rank | Disability |
| Immigrants | Saudi Arabia | 99.9 /100 | #50 | Exceptional 10.9% |
| Peruvians | 99.8 /100 | #51 | Exceptional 10.9% |
| South Americans | 99.8 /100 | #52 | Exceptional 10.9% |
| Immigrants | Spain | 99.8 /100 | #53 | Exceptional 10.9% |
| Jordanians | 99.8 /100 | #54 | Exceptional 10.9% |
| Immigrants | El Salvador | 99.8 /100 | #55 | Exceptional 10.9% |
| Immigrants | Lithuania | 99.8 /100 | #56 | Exceptional 10.9% |
| Salvadorans | 99.8 /100 | #57 | Exceptional 10.9% |
| Immigrants | South America | 99.8 /100 | #58 | Exceptional 10.9% |
| Immigrants | Colombia | 99.7 /100 | #59 | Exceptional 10.9% |
| Zimbabweans | 99.7 /100 | #60 | Exceptional 10.9% |
| Immigrants | Bulgaria | 99.7 /100 | #61 | Exceptional 10.9% |
| Immigrants | Northern Africa | 99.7 /100 | #62 | Exceptional 10.9% |
| Immigrants | Eritrea | 99.7 /100 | #63 | Exceptional 11.0% |
| Immigrants | Sweden | 99.6 /100 | #64 | Exceptional 11.0% |
Demographics Similar to Thais by Disability
In terms of disability, the demographic groups most similar to Thais are Immigrants from Taiwan (9.6%, a difference of 1.1%), Filipino (9.6%, a difference of 1.1%), Immigrants from Bolivia (9.9%, a difference of 1.6%), Immigrants from India (9.5%, a difference of 2.1%), and Immigrants from South Central Asia (9.9%, a difference of 2.5%).
| Demographics | Rating | Rank | Disability |
| Immigrants | India | 100.0 /100 | #1 | Exceptional 9.5% |
| Filipinos | 100.0 /100 | #2 | Exceptional 9.6% |
| Immigrants | Taiwan | 100.0 /100 | #3 | Exceptional 9.6% |
| Thais | 100.0 /100 | #4 | Exceptional 9.7% |
| Immigrants | Bolivia | 100.0 /100 | #5 | Exceptional 9.9% |
| Immigrants | South Central Asia | 100.0 /100 | #6 | Exceptional 9.9% |
| Immigrants | Singapore | 100.0 /100 | #7 | Exceptional 10.0% |
| Bolivians | 100.0 /100 | #8 | Exceptional 10.0% |
| Immigrants | Hong Kong | 100.0 /100 | #9 | Exceptional 10.0% |
| Immigrants | China | 100.0 /100 | #10 | Exceptional 10.1% |
| Iranians | 100.0 /100 | #11 | Exceptional 10.1% |
| Immigrants | Israel | 100.0 /100 | #12 | Exceptional 10.1% |
| Immigrants | Eastern Asia | 100.0 /100 | #13 | Exceptional 10.2% |
| Immigrants | Korea | 100.0 /100 | #14 | Exceptional 10.2% |
| Okinawans | 100.0 /100 | #15 | Exceptional 10.3% |