Puget Sound Salish vs Spanish American Indian 1 or more Vehicles in Household
COMPARE
Puget Sound Salish
Spanish American Indian
1 or more Vehicles in Household
1 or more Vehicles in Household Comparison
Puget Sound Salish
Spanish American Indians
90.5%
1 OR MORE VEHICLES IN HOUSEHOLD
91.5/ 100
METRIC RATING
124th/ 347
METRIC RANK
89.9%
1 OR MORE VEHICLES IN HOUSEHOLD
67.0/ 100
METRIC RATING
162nd/ 347
METRIC RANK
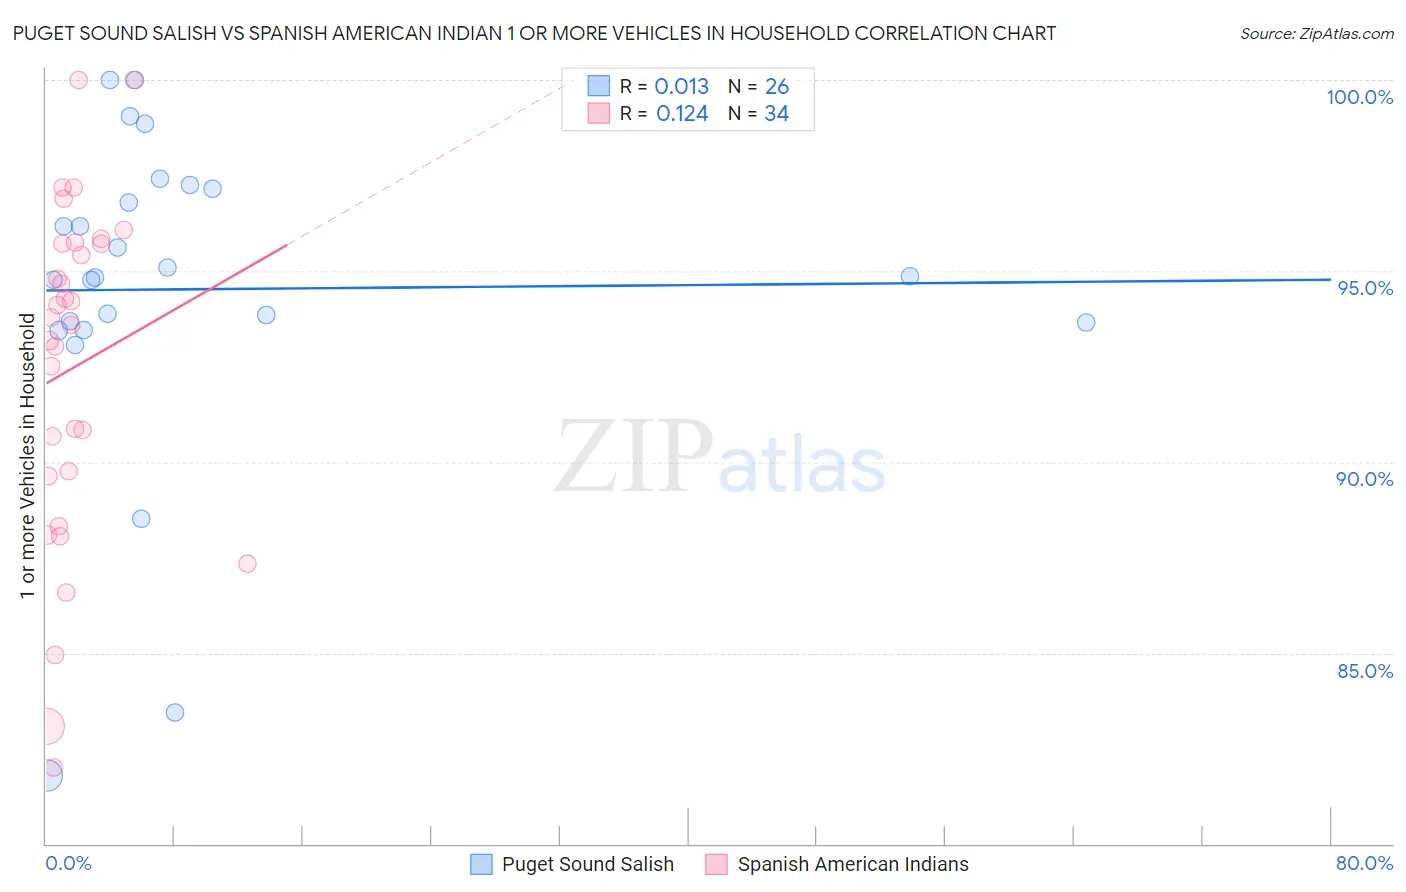
Puget Sound Salish vs Spanish American Indian 1 or more Vehicles in Household Correlation Chart
The statistical analysis conducted on geographies consisting of 46,155,865 people shows no correlation between the proportion of Puget Sound Salish and percentage of households with 1 or more vehicles available in the United States with a correlation coefficient (R) of 0.013 and weighted average of 90.5%. Similarly, the statistical analysis conducted on geographies consisting of 73,137,996 people shows a poor positive correlation between the proportion of Spanish American Indians and percentage of households with 1 or more vehicles available in the United States with a correlation coefficient (R) of 0.124 and weighted average of 89.9%, a difference of 0.65%.
1 or more Vehicles in Household Correlation Summary
| Measurement | Puget Sound Salish | Spanish American Indian |
| Minimum | 81.8% | 82.0% |
| Maximum | 100.0% | 100.0% |
| Range | 18.2% | 18.0% |
| Mean | 94.5% | 92.5% |
| Median | 94.8% | 93.7% |
| Interquartile 25% (IQ1) | 93.7% | 89.6% |
| Interquartile 75% (IQ3) | 97.2% | 95.7% |
| Interquartile Range (IQR) | 3.5% | 6.1% |
| Standard Deviation (Sample) | 4.3% | 4.5% |
| Standard Deviation (Population) | 4.2% | 4.4% |
Similar Demographics by 1 or more Vehicles in Household
Demographics Similar to Puget Sound Salish by 1 or more Vehicles in Household
In terms of 1 or more vehicles in household, the demographic groups most similar to Puget Sound Salish are Costa Rican (90.5%, a difference of 0.020%), Fijian (90.5%, a difference of 0.020%), Icelander (90.5%, a difference of 0.030%), Immigrants from Thailand (90.6%, a difference of 0.040%), and Immigrants from Korea (90.5%, a difference of 0.040%).
| Demographics | Rating | Rank | 1 or more Vehicles in Household |
| Greeks | 93.5 /100 | #117 | Exceptional 90.6% |
| Japanese | 93.4 /100 | #118 | Exceptional 90.6% |
| Blackfeet | 92.6 /100 | #119 | Exceptional 90.6% |
| Immigrants | Thailand | 92.3 /100 | #120 | Exceptional 90.6% |
| Icelanders | 92.1 /100 | #121 | Exceptional 90.5% |
| Costa Ricans | 92.0 /100 | #122 | Exceptional 90.5% |
| Fijians | 91.8 /100 | #123 | Exceptional 90.5% |
| Puget Sound Salish | 91.5 /100 | #124 | Exceptional 90.5% |
| Immigrants | Korea | 90.5 /100 | #125 | Exceptional 90.5% |
| Immigrants | Cameroon | 89.4 /100 | #126 | Excellent 90.4% |
| Immigrants | Azores | 89.1 /100 | #127 | Excellent 90.4% |
| Burmese | 89.0 /100 | #128 | Excellent 90.4% |
| Marshallese | 88.9 /100 | #129 | Excellent 90.4% |
| Nicaraguans | 88.8 /100 | #130 | Excellent 90.4% |
| Immigrants | Kenya | 88.5 /100 | #131 | Excellent 90.4% |
Demographics Similar to Spanish American Indians by 1 or more Vehicles in Household
In terms of 1 or more vehicles in household, the demographic groups most similar to Spanish American Indians are Immigrants from Indonesia (90.0%, a difference of 0.030%), Salvadoran (90.0%, a difference of 0.030%), Immigrants from Austria (89.9%, a difference of 0.030%), South African (90.0%, a difference of 0.050%), and Comanche (89.9%, a difference of 0.060%).
| Demographics | Rating | Rank | 1 or more Vehicles in Household |
| Immigrants | Immigrants | 73.6 /100 | #155 | Good 90.1% |
| Australians | 72.4 /100 | #156 | Good 90.0% |
| Immigrants | Congo | 71.2 /100 | #157 | Good 90.0% |
| Brazilians | 71.0 /100 | #158 | Good 90.0% |
| South Africans | 69.7 /100 | #159 | Good 90.0% |
| Immigrants | Indonesia | 68.8 /100 | #160 | Good 90.0% |
| Salvadorans | 68.7 /100 | #161 | Good 90.0% |
| Spanish American Indians | 67.0 /100 | #162 | Good 89.9% |
| Immigrants | Austria | 65.5 /100 | #163 | Good 89.9% |
| Comanche | 63.4 /100 | #164 | Good 89.9% |
| Immigrants | Saudi Arabia | 62.6 /100 | #165 | Good 89.9% |
| Immigrants | Middle Africa | 62.2 /100 | #166 | Good 89.9% |
| Immigrants | Latin America | 60.3 /100 | #167 | Good 89.8% |
| Immigrants | Cambodia | 60.1 /100 | #168 | Good 89.8% |
| Natives/Alaskans | 59.5 /100 | #169 | Average 89.8% |