Puget Sound Salish vs Immigrants from South Central Asia In Labor Force | Age 30-34
COMPARE
Puget Sound Salish
Immigrants from South Central Asia
In Labor Force | Age 30-34
In Labor Force | Age 30-34 Comparison
Puget Sound Salish
Immigrants from South Central Asia
82.1%
IN LABOR FORCE | AGE 30-34
0.0/ 100
METRIC RATING
308th/ 347
METRIC RANK
85.1%
IN LABOR FORCE | AGE 30-34
94.6/ 100
METRIC RATING
115th/ 347
METRIC RANK
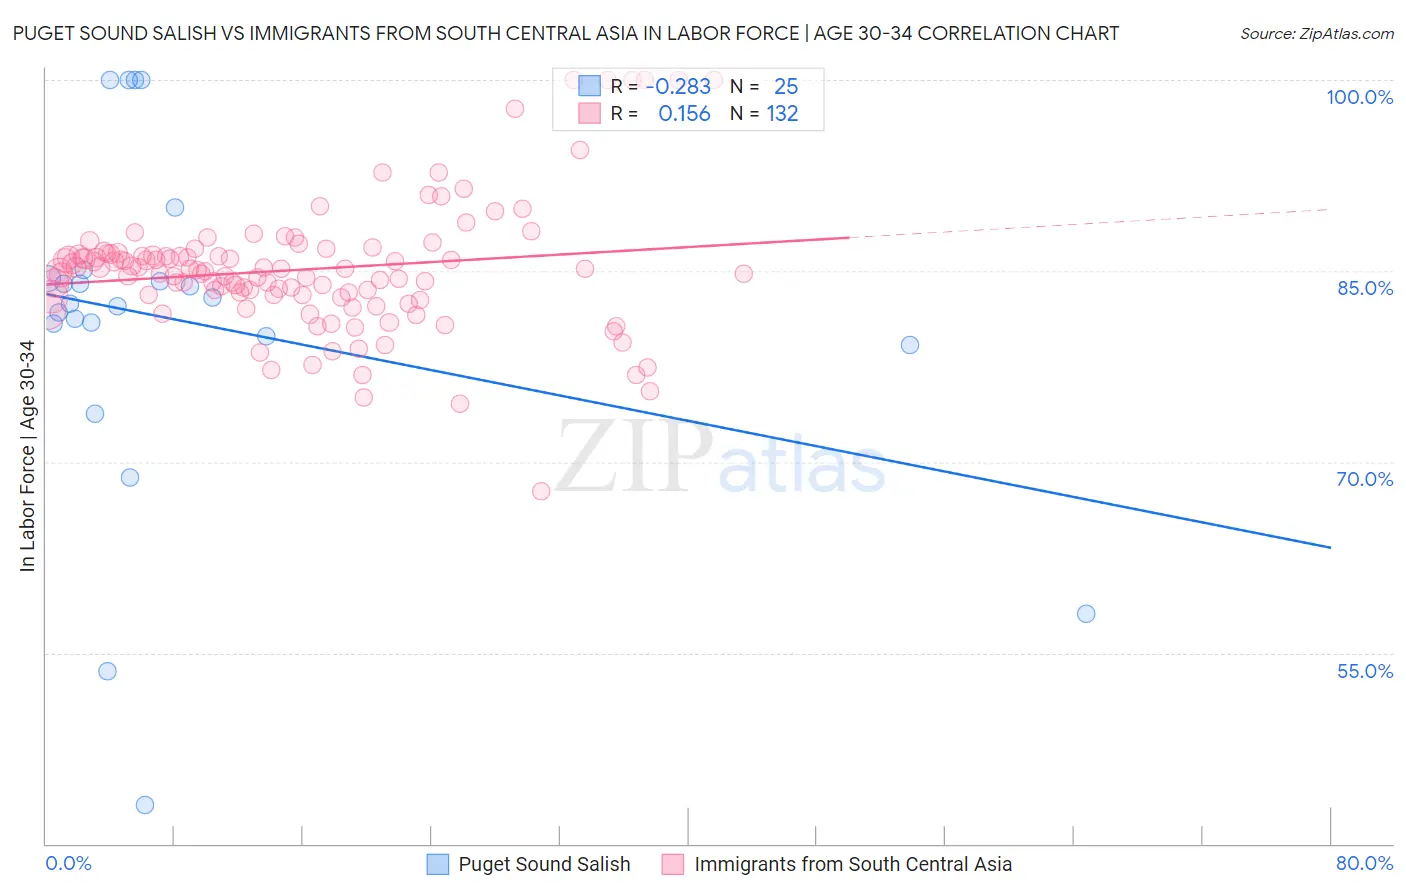
Puget Sound Salish vs Immigrants from South Central Asia In Labor Force | Age 30-34 Correlation Chart
The statistical analysis conducted on geographies consisting of 46,152,160 people shows a weak negative correlation between the proportion of Puget Sound Salish and labor force participation rate among population between the ages 30 and 34 in the United States with a correlation coefficient (R) of -0.283 and weighted average of 82.1%. Similarly, the statistical analysis conducted on geographies consisting of 472,668,502 people shows a poor positive correlation between the proportion of Immigrants from South Central Asia and labor force participation rate among population between the ages 30 and 34 in the United States with a correlation coefficient (R) of 0.156 and weighted average of 85.1%, a difference of 3.6%.
In Labor Force | Age 30-34 Correlation Summary
| Measurement | Puget Sound Salish | Immigrants from South Central Asia |
| Minimum | 43.0% | 67.7% |
| Maximum | 100.0% | 100.0% |
| Range | 57.0% | 32.3% |
| Mean | 81.0% | 85.1% |
| Median | 82.4% | 85.0% |
| Interquartile 25% (IQ1) | 79.5% | 83.1% |
| Interquartile 75% (IQ3) | 84.7% | 86.3% |
| Interquartile Range (IQR) | 5.2% | 3.2% |
| Standard Deviation (Sample) | 13.7% | 5.1% |
| Standard Deviation (Population) | 13.5% | 5.1% |
Similar Demographics by In Labor Force | Age 30-34
Demographics Similar to Puget Sound Salish by In Labor Force | Age 30-34
In terms of in labor force | age 30-34, the demographic groups most similar to Puget Sound Salish are Menominee (82.2%, a difference of 0.10%), Spanish American Indian (82.2%, a difference of 0.16%), Immigrants from Mexico (82.0%, a difference of 0.16%), Osage (82.3%, a difference of 0.17%), and Cajun (82.0%, a difference of 0.19%).
| Demographics | Rating | Rank | In Labor Force | Age 30-34 |
| Hispanics or Latinos | 0.0 /100 | #301 | Tragic 82.4% |
| Ottawa | 0.0 /100 | #302 | Tragic 82.4% |
| Immigrants | Micronesia | 0.0 /100 | #303 | Tragic 82.4% |
| Tlingit-Haida | 0.0 /100 | #304 | Tragic 82.3% |
| Osage | 0.0 /100 | #305 | Tragic 82.3% |
| Spanish American Indians | 0.0 /100 | #306 | Tragic 82.2% |
| Menominee | 0.0 /100 | #307 | Tragic 82.2% |
| Puget Sound Salish | 0.0 /100 | #308 | Tragic 82.1% |
| Immigrants | Mexico | 0.0 /100 | #309 | Tragic 82.0% |
| Cajuns | 0.0 /100 | #310 | Tragic 82.0% |
| Chickasaw | 0.0 /100 | #311 | Tragic 81.9% |
| Mexicans | 0.0 /100 | #312 | Tragic 81.9% |
| Iroquois | 0.0 /100 | #313 | Tragic 81.9% |
| Alaskan Athabascans | 0.0 /100 | #314 | Tragic 81.7% |
| Cherokee | 0.0 /100 | #315 | Tragic 81.6% |
Demographics Similar to Immigrants from South Central Asia by In Labor Force | Age 30-34
In terms of in labor force | age 30-34, the demographic groups most similar to Immigrants from South Central Asia are Immigrants from Romania (85.1%, a difference of 0.0%), Yugoslavian (85.1%, a difference of 0.0%), Egyptian (85.1%, a difference of 0.0%), Immigrants from Scotland (85.1%, a difference of 0.010%), and Immigrants from Hungary (85.1%, a difference of 0.010%).
| Demographics | Rating | Rank | In Labor Force | Age 30-34 |
| Immigrants | Zimbabwe | 95.8 /100 | #108 | Exceptional 85.1% |
| Argentineans | 95.8 /100 | #109 | Exceptional 85.1% |
| Immigrants | South Africa | 95.3 /100 | #110 | Exceptional 85.1% |
| Immigrants | Scotland | 94.9 /100 | #111 | Exceptional 85.1% |
| Immigrants | Hungary | 94.8 /100 | #112 | Exceptional 85.1% |
| Immigrants | Romania | 94.7 /100 | #113 | Exceptional 85.1% |
| Yugoslavians | 94.7 /100 | #114 | Exceptional 85.1% |
| Immigrants | South Central Asia | 94.6 /100 | #115 | Exceptional 85.1% |
| Egyptians | 94.5 /100 | #116 | Exceptional 85.1% |
| Immigrants | Denmark | 94.3 /100 | #117 | Exceptional 85.1% |
| Immigrants | Malaysia | 94.2 /100 | #118 | Exceptional 85.1% |
| Asians | 93.4 /100 | #119 | Exceptional 85.1% |
| Immigrants | Southern Europe | 93.3 /100 | #120 | Exceptional 85.1% |
| Immigrants | Egypt | 93.2 /100 | #121 | Exceptional 85.1% |
| Immigrants | Kuwait | 92.6 /100 | #122 | Exceptional 85.1% |