Polish vs Slovak Disability
COMPARE
Polish
Slovak
Disability
Disability Comparison
Poles
Slovaks
12.2%
DISABILITY
1.7/ 100
METRIC RATING
242nd/ 347
METRIC RANK
13.0%
DISABILITY
0.0/ 100
METRIC RATING
289th/ 347
METRIC RANK
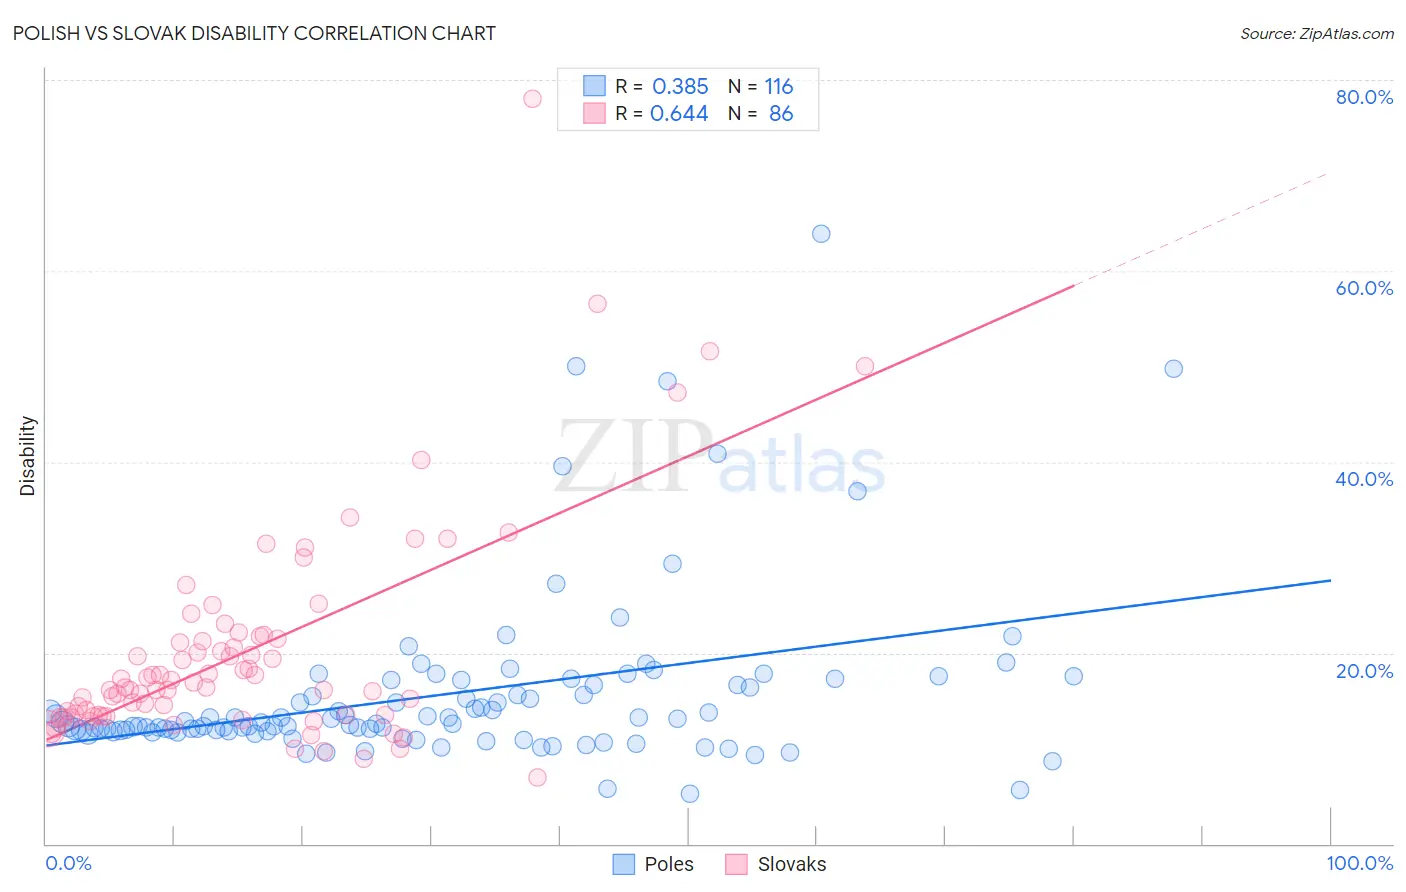
Polish vs Slovak Disability Correlation Chart
The statistical analysis conducted on geographies consisting of 560,456,636 people shows a mild positive correlation between the proportion of Poles and percentage of population with a disability in the United States with a correlation coefficient (R) of 0.385 and weighted average of 12.2%. Similarly, the statistical analysis conducted on geographies consisting of 397,863,317 people shows a significant positive correlation between the proportion of Slovaks and percentage of population with a disability in the United States with a correlation coefficient (R) of 0.644 and weighted average of 13.0%, a difference of 6.4%.
Disability Correlation Summary
| Measurement | Polish | Slovak |
| Minimum | 5.3% | 6.9% |
| Maximum | 63.9% | 78.0% |
| Range | 58.6% | 71.1% |
| Mean | 15.6% | 20.1% |
| Median | 12.7% | 16.4% |
| Interquartile 25% (IQ1) | 11.8% | 13.5% |
| Interquartile 75% (IQ3) | 16.6% | 21.4% |
| Interquartile Range (IQR) | 4.8% | 7.9% |
| Standard Deviation (Sample) | 9.1% | 11.4% |
| Standard Deviation (Population) | 9.0% | 11.3% |
Similar Demographics by Disability
Demographics Similar to Poles by Disability
In terms of disability, the demographic groups most similar to Poles are Hungarian (12.2%, a difference of 0.020%), Yugoslavian (12.2%, a difference of 0.020%), Swedish (12.2%, a difference of 0.080%), British (12.2%, a difference of 0.090%), and Basque (12.2%, a difference of 0.090%).
| Demographics | Rating | Rank | Disability |
| Yup'ik | 2.2 /100 | #235 | Tragic 12.2% |
| Chinese | 2.0 /100 | #236 | Tragic 12.2% |
| Immigrants | Congo | 1.9 /100 | #237 | Tragic 12.2% |
| Norwegians | 1.9 /100 | #238 | Tragic 12.2% |
| Swedes | 1.8 /100 | #239 | Tragic 12.2% |
| Hungarians | 1.7 /100 | #240 | Tragic 12.2% |
| Yugoslavians | 1.7 /100 | #241 | Tragic 12.2% |
| Poles | 1.7 /100 | #242 | Tragic 12.2% |
| British | 1.5 /100 | #243 | Tragic 12.2% |
| Basques | 1.5 /100 | #244 | Tragic 12.2% |
| Liberians | 1.5 /100 | #245 | Tragic 12.2% |
| Swiss | 1.5 /100 | #246 | Tragic 12.2% |
| Indonesians | 1.4 /100 | #247 | Tragic 12.2% |
| Guamanians/Chamorros | 1.4 /100 | #248 | Tragic 12.3% |
| Carpatho Rusyns | 1.4 /100 | #249 | Tragic 12.3% |
Demographics Similar to Slovaks by Disability
In terms of disability, the demographic groups most similar to Slovaks are White/Caucasian (13.0%, a difference of 0.0%), African (13.0%, a difference of 0.020%), Cheyenne (13.0%, a difference of 0.060%), Yaqui (13.1%, a difference of 0.28%), and English (13.0%, a difference of 0.44%).
| Demographics | Rating | Rank | Disability |
| Scottish | 0.0 /100 | #282 | Tragic 12.9% |
| Irish | 0.0 /100 | #283 | Tragic 12.9% |
| Welsh | 0.0 /100 | #284 | Tragic 12.9% |
| Crow | 0.0 /100 | #285 | Tragic 12.9% |
| English | 0.0 /100 | #286 | Tragic 13.0% |
| Africans | 0.0 /100 | #287 | Tragic 13.0% |
| Whites/Caucasians | 0.0 /100 | #288 | Tragic 13.0% |
| Slovaks | 0.0 /100 | #289 | Tragic 13.0% |
| Cheyenne | 0.0 /100 | #290 | Tragic 13.0% |
| Yaqui | 0.0 /100 | #291 | Tragic 13.1% |
| Aleuts | 0.0 /100 | #292 | Tragic 13.1% |
| Marshallese | 0.0 /100 | #293 | Tragic 13.1% |
| Celtics | 0.0 /100 | #294 | Tragic 13.1% |
| Immigrants | Nonimmigrants | 0.0 /100 | #295 | Tragic 13.2% |
| Central American Indians | 0.0 /100 | #296 | Tragic 13.2% |