Portuguese vs Slovak Disability
COMPARE
Portuguese
Slovak
Disability
Disability Comparison
Portuguese
Slovaks
12.6%
DISABILITY
0.1/ 100
METRIC RATING
270th/ 347
METRIC RANK
13.0%
DISABILITY
0.0/ 100
METRIC RATING
289th/ 347
METRIC RANK
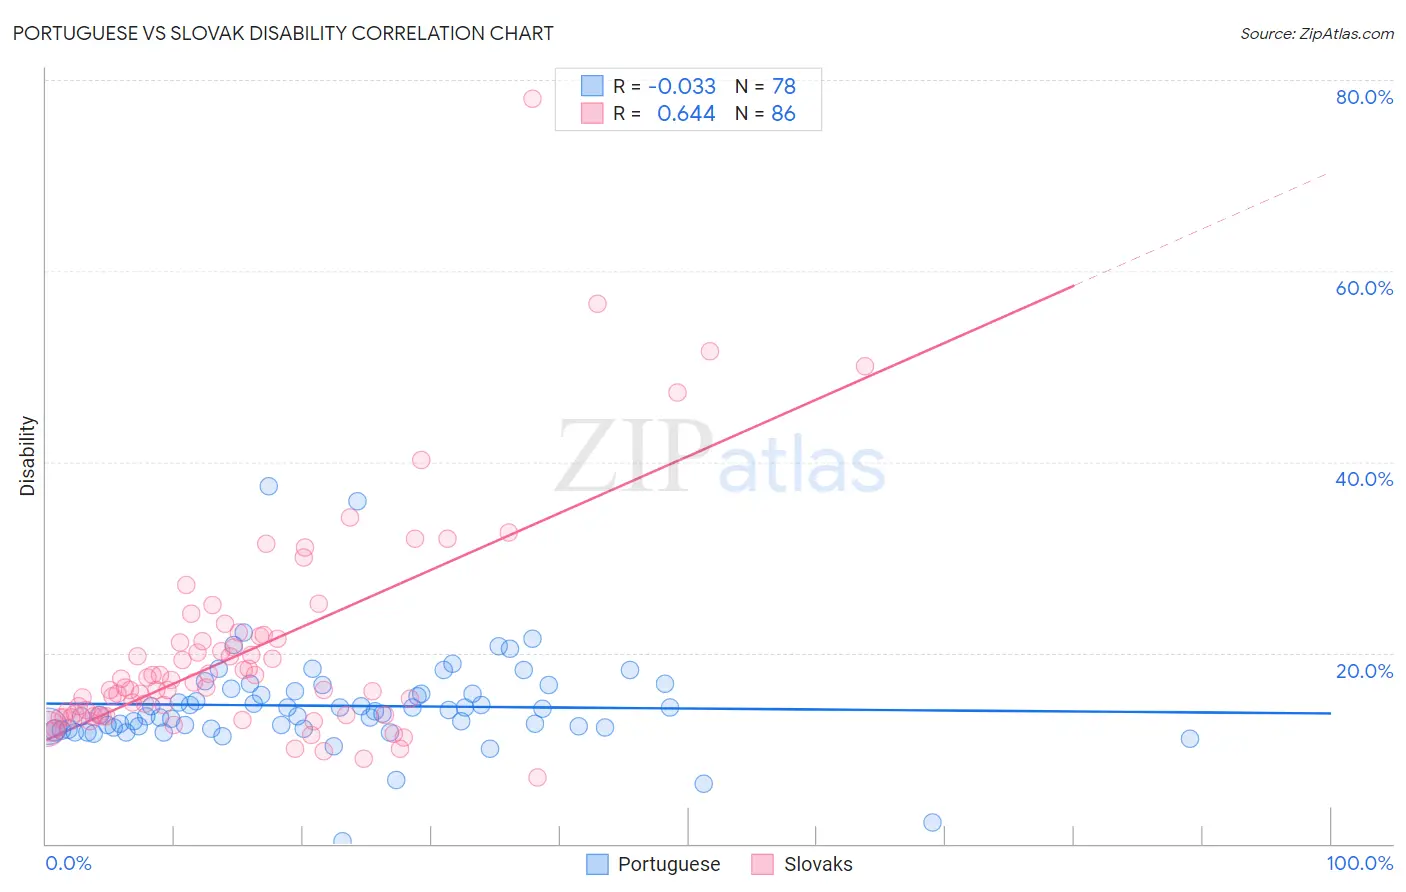
Portuguese vs Slovak Disability Correlation Chart
The statistical analysis conducted on geographies consisting of 450,275,372 people shows no correlation between the proportion of Portuguese and percentage of population with a disability in the United States with a correlation coefficient (R) of -0.033 and weighted average of 12.6%. Similarly, the statistical analysis conducted on geographies consisting of 397,863,317 people shows a significant positive correlation between the proportion of Slovaks and percentage of population with a disability in the United States with a correlation coefficient (R) of 0.644 and weighted average of 13.0%, a difference of 3.1%.
Disability Correlation Summary
| Measurement | Portuguese | Slovak |
| Minimum | 0.28% | 6.9% |
| Maximum | 37.5% | 78.0% |
| Range | 37.2% | 71.1% |
| Mean | 14.4% | 20.1% |
| Median | 13.8% | 16.4% |
| Interquartile 25% (IQ1) | 12.2% | 13.5% |
| Interquartile 75% (IQ3) | 15.9% | 21.4% |
| Interquartile Range (IQR) | 3.7% | 7.9% |
| Standard Deviation (Sample) | 5.1% | 11.4% |
| Standard Deviation (Population) | 5.1% | 11.3% |
Demographics Similar to Portuguese and Slovaks by Disability
In terms of disability, the demographic groups most similar to Portuguese are Immigrants from Yemen (12.6%, a difference of 0.050%), Immigrants from Dominican Republic (12.6%, a difference of 0.39%), Dominican (12.7%, a difference of 0.54%), Finnish (12.7%, a difference of 0.70%), and Nepalese (12.8%, a difference of 1.1%). Similarly, the demographic groups most similar to Slovaks are White/Caucasian (13.0%, a difference of 0.0%), African (13.0%, a difference of 0.020%), English (13.0%, a difference of 0.44%), Welsh (12.9%, a difference of 0.82%), and Crow (12.9%, a difference of 0.82%).
| Demographics | Rating | Rank | Disability |
| Immigrants | Dominican Republic | 0.1 /100 | #269 | Tragic 12.6% |
| Portuguese | 0.1 /100 | #270 | Tragic 12.6% |
| Immigrants | Yemen | 0.1 /100 | #271 | Tragic 12.6% |
| Dominicans | 0.0 /100 | #272 | Tragic 12.7% |
| Finns | 0.0 /100 | #273 | Tragic 12.7% |
| Nepalese | 0.0 /100 | #274 | Tragic 12.8% |
| Sioux | 0.0 /100 | #275 | Tragic 12.8% |
| Hmong | 0.0 /100 | #276 | Tragic 12.8% |
| Dutch | 0.0 /100 | #277 | Tragic 12.8% |
| Germans | 0.0 /100 | #278 | Tragic 12.8% |
| Fijians | 0.0 /100 | #279 | Tragic 12.8% |
| Spanish | 0.0 /100 | #280 | Tragic 12.8% |
| Immigrants | Portugal | 0.0 /100 | #281 | Tragic 12.9% |
| Scottish | 0.0 /100 | #282 | Tragic 12.9% |
| Irish | 0.0 /100 | #283 | Tragic 12.9% |
| Welsh | 0.0 /100 | #284 | Tragic 12.9% |
| Crow | 0.0 /100 | #285 | Tragic 12.9% |
| English | 0.0 /100 | #286 | Tragic 13.0% |
| Africans | 0.0 /100 | #287 | Tragic 13.0% |
| Whites/Caucasians | 0.0 /100 | #288 | Tragic 13.0% |
| Slovaks | 0.0 /100 | #289 | Tragic 13.0% |