Polish vs Slovak Bachelor's Degree
COMPARE
Polish
Slovak
Bachelor's Degree
Bachelor's Degree Comparison
Poles
Slovaks
39.1%
BACHELOR'S DEGREE
79.8/ 100
METRIC RATING
143rd/ 347
METRIC RANK
37.3%
BACHELOR'S DEGREE
36.9/ 100
METRIC RATING
189th/ 347
METRIC RANK
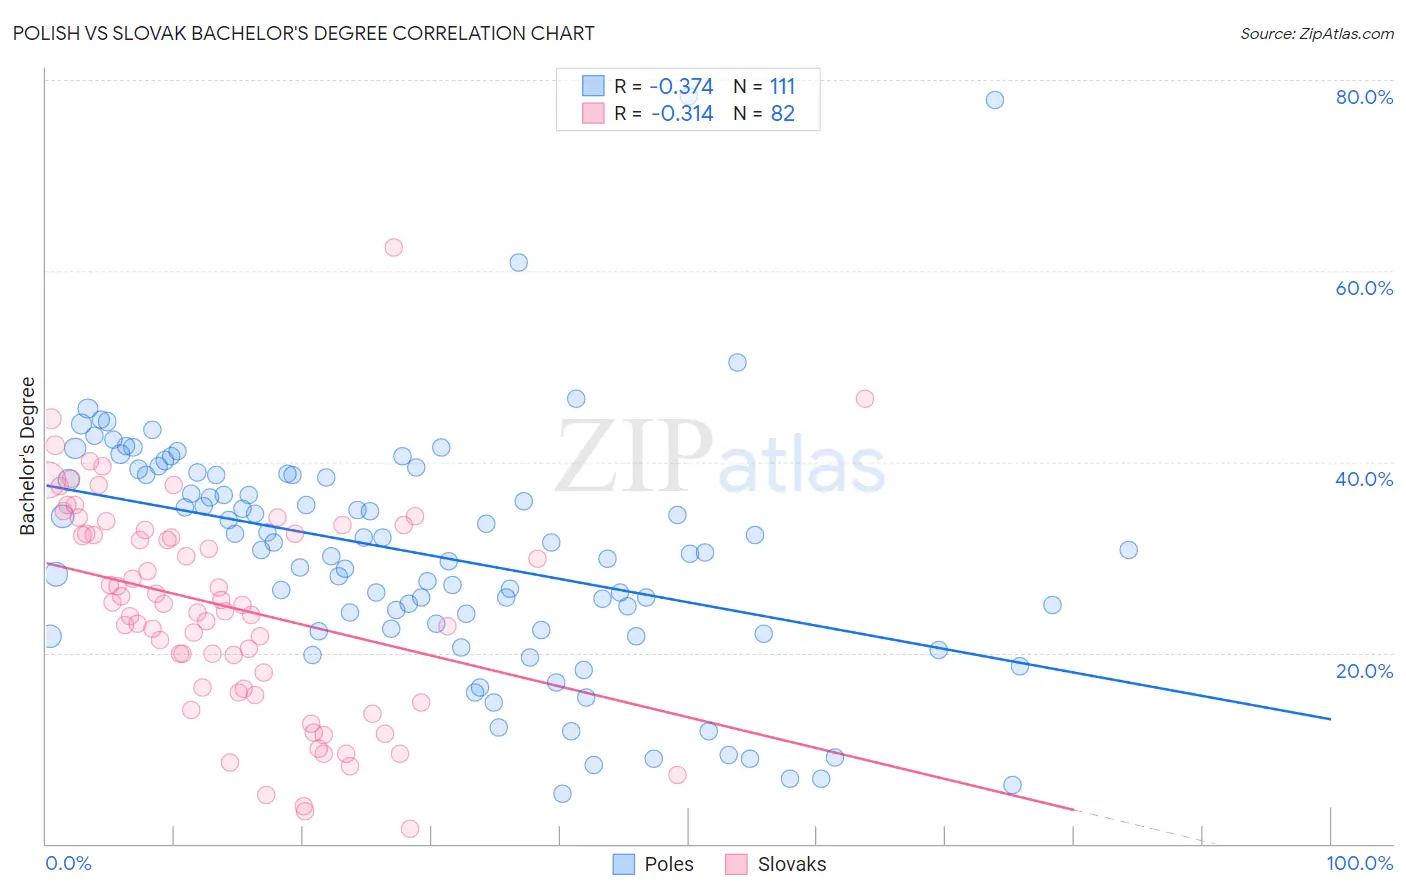
Polish vs Slovak Bachelor's Degree Correlation Chart
The statistical analysis conducted on geographies consisting of 560,456,135 people shows a mild negative correlation between the proportion of Poles and percentage of population with at least bachelor's degree education in the United States with a correlation coefficient (R) of -0.374 and weighted average of 39.1%. Similarly, the statistical analysis conducted on geographies consisting of 397,863,684 people shows a mild negative correlation between the proportion of Slovaks and percentage of population with at least bachelor's degree education in the United States with a correlation coefficient (R) of -0.314 and weighted average of 37.3%, a difference of 4.7%.
Bachelor's Degree Correlation Summary
| Measurement | Polish | Slovak |
| Minimum | 5.2% | 1.5% |
| Maximum | 78.3% | 62.5% |
| Range | 73.0% | 61.0% |
| Mean | 30.3% | 24.8% |
| Median | 30.7% | 25.1% |
| Interquartile 25% (IQ1) | 22.4% | 16.2% |
| Interquartile 75% (IQ3) | 38.7% | 32.9% |
| Interquartile Range (IQR) | 16.3% | 16.7% |
| Standard Deviation (Sample) | 12.7% | 11.3% |
| Standard Deviation (Population) | 12.7% | 11.3% |
Similar Demographics by Bachelor's Degree
Demographics Similar to Poles by Bachelor's Degree
In terms of bachelor's degree, the demographic groups most similar to Poles are Immigrants from Afghanistan (39.1%, a difference of 0.020%), Slovene (39.1%, a difference of 0.050%), Swedish (39.1%, a difference of 0.090%), Immigrants from Sierra Leone (39.0%, a difference of 0.12%), and Iraqi (39.0%, a difference of 0.25%).
| Demographics | Rating | Rank | Bachelor's Degree |
| Pakistanis | 88.2 /100 | #136 | Excellent 39.7% |
| Icelanders | 86.5 /100 | #137 | Excellent 39.5% |
| Europeans | 85.6 /100 | #138 | Excellent 39.5% |
| Immigrants | Sudan | 84.5 /100 | #139 | Excellent 39.4% |
| Immigrants | Armenia | 84.1 /100 | #140 | Excellent 39.4% |
| South American Indians | 83.6 /100 | #141 | Excellent 39.3% |
| Immigrants | North Macedonia | 81.6 /100 | #142 | Excellent 39.2% |
| Poles | 79.8 /100 | #143 | Good 39.1% |
| Immigrants | Afghanistan | 79.7 /100 | #144 | Good 39.1% |
| Slovenes | 79.5 /100 | #145 | Good 39.1% |
| Swedes | 79.2 /100 | #146 | Good 39.1% |
| Immigrants | Sierra Leone | 79.0 /100 | #147 | Good 39.0% |
| Iraqis | 78.1 /100 | #148 | Good 39.0% |
| Immigrants | Poland | 77.5 /100 | #149 | Good 39.0% |
| South Americans | 77.3 /100 | #150 | Good 38.9% |
Demographics Similar to Slovaks by Bachelor's Degree
In terms of bachelor's degree, the demographic groups most similar to Slovaks are Immigrants from Oceania (37.3%, a difference of 0.050%), English (37.4%, a difference of 0.29%), Swiss (37.2%, a difference of 0.30%), Nigerian (37.2%, a difference of 0.32%), and Norwegian (37.5%, a difference of 0.36%).
| Demographics | Rating | Rank | Bachelor's Degree |
| Immigrants | Bosnia and Herzegovina | 43.4 /100 | #182 | Average 37.6% |
| Senegalese | 42.2 /100 | #183 | Average 37.5% |
| Scandinavians | 41.7 /100 | #184 | Average 37.5% |
| Immigrants | Peru | 41.3 /100 | #185 | Average 37.5% |
| Norwegians | 40.4 /100 | #186 | Average 37.5% |
| English | 39.7 /100 | #187 | Fair 37.4% |
| Immigrants | Oceania | 37.3 /100 | #188 | Fair 37.3% |
| Slovaks | 36.9 /100 | #189 | Fair 37.3% |
| Swiss | 34.1 /100 | #190 | Fair 37.2% |
| Nigerians | 33.9 /100 | #191 | Fair 37.2% |
| Immigrants | Vietnam | 32.1 /100 | #192 | Fair 37.1% |
| Yugoslavians | 31.5 /100 | #193 | Fair 37.1% |
| Belgians | 29.9 /100 | #194 | Fair 37.0% |
| Koreans | 29.8 /100 | #195 | Fair 37.0% |
| Celtics | 29.5 /100 | #196 | Fair 37.0% |