Polish vs Immigrants from Australia Disability
COMPARE
Polish
Immigrants from Australia
Disability
Disability Comparison
Poles
Immigrants from Australia
12.2%
DISABILITY
1.7/ 100
METRIC RATING
242nd/ 347
METRIC RANK
10.8%
DISABILITY
99.9/ 100
METRIC RATING
41st/ 347
METRIC RANK
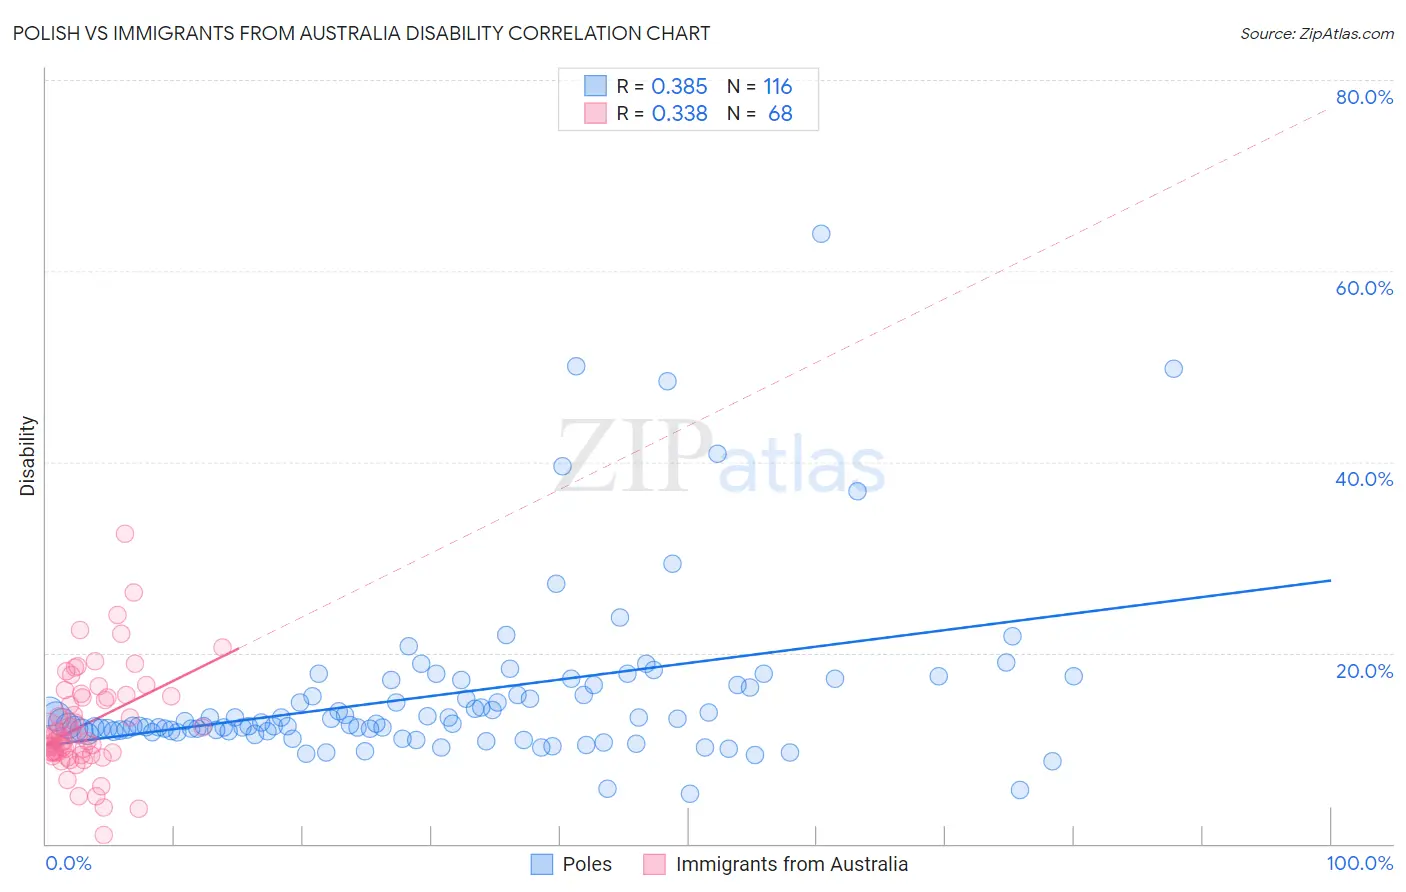
Polish vs Immigrants from Australia Disability Correlation Chart
The statistical analysis conducted on geographies consisting of 560,456,636 people shows a mild positive correlation between the proportion of Poles and percentage of population with a disability in the United States with a correlation coefficient (R) of 0.385 and weighted average of 12.2%. Similarly, the statistical analysis conducted on geographies consisting of 227,205,493 people shows a mild positive correlation between the proportion of Immigrants from Australia and percentage of population with a disability in the United States with a correlation coefficient (R) of 0.338 and weighted average of 10.8%, a difference of 13.5%.
Disability Correlation Summary
| Measurement | Polish | Immigrants from Australia |
| Minimum | 5.3% | 0.92% |
| Maximum | 63.9% | 32.5% |
| Range | 58.6% | 31.6% |
| Mean | 15.6% | 12.6% |
| Median | 12.7% | 11.1% |
| Interquartile 25% (IQ1) | 11.8% | 9.5% |
| Interquartile 75% (IQ3) | 16.6% | 15.5% |
| Interquartile Range (IQR) | 4.8% | 6.0% |
| Standard Deviation (Sample) | 9.1% | 5.5% |
| Standard Deviation (Population) | 9.0% | 5.4% |
Similar Demographics by Disability
Demographics Similar to Poles by Disability
In terms of disability, the demographic groups most similar to Poles are Hungarian (12.2%, a difference of 0.020%), Yugoslavian (12.2%, a difference of 0.020%), Swedish (12.2%, a difference of 0.080%), British (12.2%, a difference of 0.090%), and Basque (12.2%, a difference of 0.090%).
| Demographics | Rating | Rank | Disability |
| Yup'ik | 2.2 /100 | #235 | Tragic 12.2% |
| Chinese | 2.0 /100 | #236 | Tragic 12.2% |
| Immigrants | Congo | 1.9 /100 | #237 | Tragic 12.2% |
| Norwegians | 1.9 /100 | #238 | Tragic 12.2% |
| Swedes | 1.8 /100 | #239 | Tragic 12.2% |
| Hungarians | 1.7 /100 | #240 | Tragic 12.2% |
| Yugoslavians | 1.7 /100 | #241 | Tragic 12.2% |
| Poles | 1.7 /100 | #242 | Tragic 12.2% |
| British | 1.5 /100 | #243 | Tragic 12.2% |
| Basques | 1.5 /100 | #244 | Tragic 12.2% |
| Liberians | 1.5 /100 | #245 | Tragic 12.2% |
| Swiss | 1.5 /100 | #246 | Tragic 12.2% |
| Indonesians | 1.4 /100 | #247 | Tragic 12.2% |
| Guamanians/Chamorros | 1.4 /100 | #248 | Tragic 12.3% |
| Carpatho Rusyns | 1.4 /100 | #249 | Tragic 12.3% |
Demographics Similar to Immigrants from Australia by Disability
In terms of disability, the demographic groups most similar to Immigrants from Australia are Cambodian (10.8%, a difference of 0.040%), Mongolian (10.8%, a difference of 0.040%), Immigrants from Nepal (10.8%, a difference of 0.10%), Afghan (10.8%, a difference of 0.15%), and Israeli (10.8%, a difference of 0.15%).
| Demographics | Rating | Rank | Disability |
| Immigrants | Ethiopia | 100.0 /100 | #34 | Exceptional 10.7% |
| Immigrants | Indonesia | 100.0 /100 | #35 | Exceptional 10.7% |
| Ethiopians | 100.0 /100 | #36 | Exceptional 10.7% |
| Turks | 100.0 /100 | #37 | Exceptional 10.7% |
| Afghans | 99.9 /100 | #38 | Exceptional 10.8% |
| Cambodians | 99.9 /100 | #39 | Exceptional 10.8% |
| Mongolians | 99.9 /100 | #40 | Exceptional 10.8% |
| Immigrants | Australia | 99.9 /100 | #41 | Exceptional 10.8% |
| Immigrants | Nepal | 99.9 /100 | #42 | Exceptional 10.8% |
| Israelis | 99.9 /100 | #43 | Exceptional 10.8% |
| Immigrants | Japan | 99.9 /100 | #44 | Exceptional 10.8% |
| Immigrants | Peru | 99.9 /100 | #45 | Exceptional 10.8% |
| Tongans | 99.9 /100 | #46 | Exceptional 10.8% |
| Taiwanese | 99.9 /100 | #47 | Exceptional 10.8% |
| Soviet Union | 99.9 /100 | #48 | Exceptional 10.9% |