Immigrants from Guyana vs Slovak Disability
COMPARE
Immigrants from Guyana
Slovak
Disability
Disability Comparison
Immigrants from Guyana
Slovaks
11.4%
DISABILITY
88.3/ 100
METRIC RATING
134th/ 347
METRIC RANK
13.0%
DISABILITY
0.0/ 100
METRIC RATING
289th/ 347
METRIC RANK
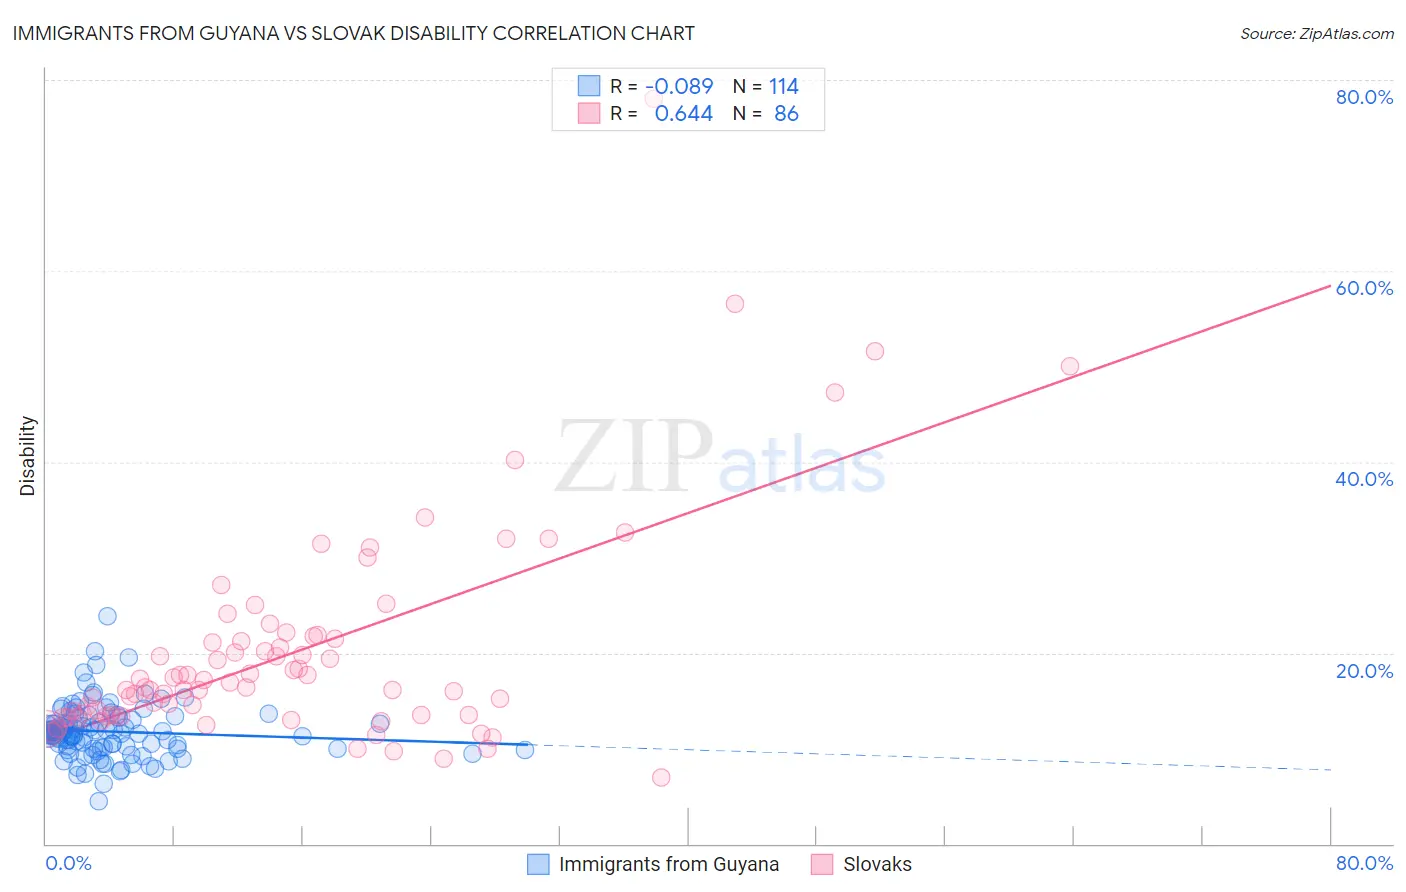
Immigrants from Guyana vs Slovak Disability Correlation Chart
The statistical analysis conducted on geographies consisting of 183,715,267 people shows a slight negative correlation between the proportion of Immigrants from Guyana and percentage of population with a disability in the United States with a correlation coefficient (R) of -0.089 and weighted average of 11.4%. Similarly, the statistical analysis conducted on geographies consisting of 397,863,317 people shows a significant positive correlation between the proportion of Slovaks and percentage of population with a disability in the United States with a correlation coefficient (R) of 0.644 and weighted average of 13.0%, a difference of 13.8%.
Disability Correlation Summary
| Measurement | Immigrants from Guyana | Slovak |
| Minimum | 4.4% | 6.9% |
| Maximum | 23.8% | 78.0% |
| Range | 19.4% | 71.1% |
| Mean | 11.8% | 20.1% |
| Median | 11.6% | 16.4% |
| Interquartile 25% (IQ1) | 10.1% | 13.5% |
| Interquartile 75% (IQ3) | 13.0% | 21.4% |
| Interquartile Range (IQR) | 2.8% | 7.9% |
| Standard Deviation (Sample) | 2.8% | 11.4% |
| Standard Deviation (Population) | 2.8% | 11.3% |
Similar Demographics by Disability
Demographics Similar to Immigrants from Guyana by Disability
In terms of disability, the demographic groups most similar to Immigrants from Guyana are Ugandan (11.4%, a difference of 0.050%), Immigrants from St. Vincent and the Grenadines (11.4%, a difference of 0.060%), Arab (11.4%, a difference of 0.080%), Immigrants from Africa (11.4%, a difference of 0.11%), and Kenyan (11.5%, a difference of 0.13%).
| Demographics | Rating | Rank | Disability |
| Immigrants | Italy | 90.4 /100 | #127 | Exceptional 11.4% |
| Immigrants | Europe | 90.4 /100 | #128 | Exceptional 11.4% |
| Macedonians | 90.3 /100 | #129 | Exceptional 11.4% |
| Latvians | 89.8 /100 | #130 | Excellent 11.4% |
| Immigrants | Croatia | 89.8 /100 | #131 | Excellent 11.4% |
| Immigrants | Africa | 89.3 /100 | #132 | Excellent 11.4% |
| Arabs | 89.1 /100 | #133 | Excellent 11.4% |
| Immigrants | Guyana | 88.3 /100 | #134 | Excellent 11.4% |
| Ugandans | 87.9 /100 | #135 | Excellent 11.4% |
| Immigrants | St. Vincent and the Grenadines | 87.8 /100 | #136 | Excellent 11.4% |
| Kenyans | 87.1 /100 | #137 | Excellent 11.5% |
| New Zealanders | 87.0 /100 | #138 | Excellent 11.5% |
| Ghanaians | 87.0 /100 | #139 | Excellent 11.5% |
| Russians | 86.8 /100 | #140 | Excellent 11.5% |
| Immigrants | Grenada | 86.1 /100 | #141 | Excellent 11.5% |
Demographics Similar to Slovaks by Disability
In terms of disability, the demographic groups most similar to Slovaks are White/Caucasian (13.0%, a difference of 0.0%), African (13.0%, a difference of 0.020%), Cheyenne (13.0%, a difference of 0.060%), Yaqui (13.1%, a difference of 0.28%), and English (13.0%, a difference of 0.44%).
| Demographics | Rating | Rank | Disability |
| Scottish | 0.0 /100 | #282 | Tragic 12.9% |
| Irish | 0.0 /100 | #283 | Tragic 12.9% |
| Welsh | 0.0 /100 | #284 | Tragic 12.9% |
| Crow | 0.0 /100 | #285 | Tragic 12.9% |
| English | 0.0 /100 | #286 | Tragic 13.0% |
| Africans | 0.0 /100 | #287 | Tragic 13.0% |
| Whites/Caucasians | 0.0 /100 | #288 | Tragic 13.0% |
| Slovaks | 0.0 /100 | #289 | Tragic 13.0% |
| Cheyenne | 0.0 /100 | #290 | Tragic 13.0% |
| Yaqui | 0.0 /100 | #291 | Tragic 13.1% |
| Aleuts | 0.0 /100 | #292 | Tragic 13.1% |
| Marshallese | 0.0 /100 | #293 | Tragic 13.1% |
| Celtics | 0.0 /100 | #294 | Tragic 13.1% |
| Immigrants | Nonimmigrants | 0.0 /100 | #295 | Tragic 13.2% |
| Central American Indians | 0.0 /100 | #296 | Tragic 13.2% |