Immigrants from Belgium vs Slovak Disability
COMPARE
Immigrants from Belgium
Slovak
Disability
Disability Comparison
Immigrants from Belgium
Slovaks
11.0%
DISABILITY
99.3/ 100
METRIC RATING
77th/ 347
METRIC RANK
13.0%
DISABILITY
0.0/ 100
METRIC RATING
289th/ 347
METRIC RANK
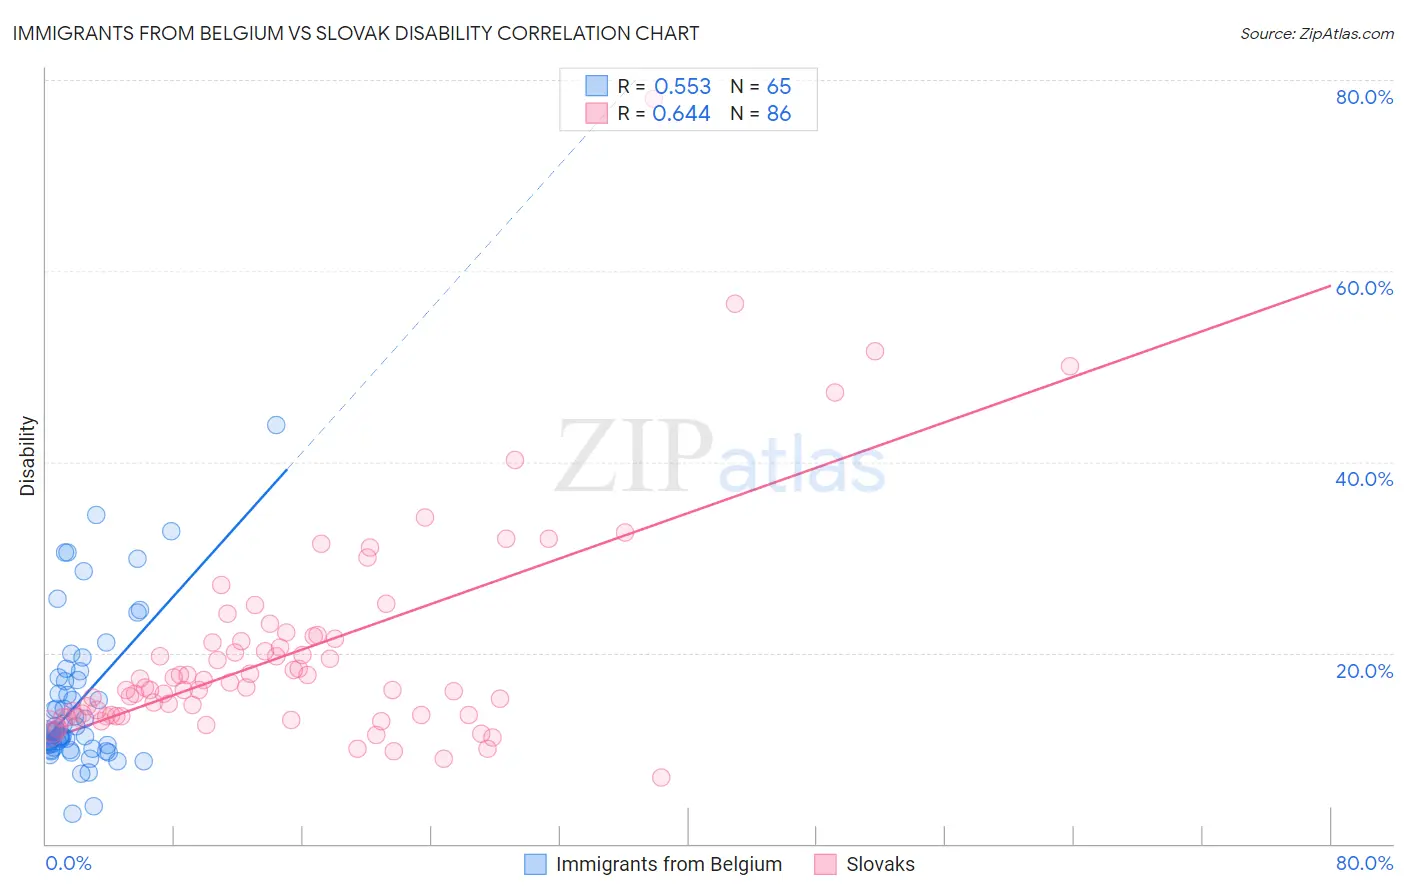
Immigrants from Belgium vs Slovak Disability Correlation Chart
The statistical analysis conducted on geographies consisting of 146,717,814 people shows a substantial positive correlation between the proportion of Immigrants from Belgium and percentage of population with a disability in the United States with a correlation coefficient (R) of 0.553 and weighted average of 11.0%. Similarly, the statistical analysis conducted on geographies consisting of 397,863,317 people shows a significant positive correlation between the proportion of Slovaks and percentage of population with a disability in the United States with a correlation coefficient (R) of 0.644 and weighted average of 13.0%, a difference of 17.8%.
Disability Correlation Summary
| Measurement | Immigrants from Belgium | Slovak |
| Minimum | 3.1% | 6.9% |
| Maximum | 43.8% | 78.0% |
| Range | 40.7% | 71.1% |
| Mean | 14.9% | 20.1% |
| Median | 11.7% | 16.4% |
| Interquartile 25% (IQ1) | 10.2% | 13.5% |
| Interquartile 75% (IQ3) | 17.3% | 21.4% |
| Interquartile Range (IQR) | 7.1% | 7.9% |
| Standard Deviation (Sample) | 7.8% | 11.4% |
| Standard Deviation (Population) | 7.7% | 11.3% |
Similar Demographics by Disability
Demographics Similar to Immigrants from Belgium by Disability
In terms of disability, the demographic groups most similar to Immigrants from Belgium are Sierra Leonean (11.0%, a difference of 0.0%), Immigrants from Vietnam (11.0%, a difference of 0.030%), Immigrants from Cameroon (11.1%, a difference of 0.040%), Immigrants from Serbia (11.0%, a difference of 0.050%), and Immigrants from Bangladesh (11.0%, a difference of 0.070%).
| Demographics | Rating | Rank | Disability |
| Immigrants | France | 99.4 /100 | #70 | Exceptional 11.0% |
| Immigrants | Lebanon | 99.4 /100 | #71 | Exceptional 11.0% |
| Immigrants | Chile | 99.4 /100 | #72 | Exceptional 11.0% |
| Immigrants | Bangladesh | 99.4 /100 | #73 | Exceptional 11.0% |
| Immigrants | Serbia | 99.4 /100 | #74 | Exceptional 11.0% |
| Immigrants | Vietnam | 99.4 /100 | #75 | Exceptional 11.0% |
| Sierra Leoneans | 99.3 /100 | #76 | Exceptional 11.0% |
| Immigrants | Belgium | 99.3 /100 | #77 | Exceptional 11.0% |
| Immigrants | Cameroon | 99.3 /100 | #78 | Exceptional 11.1% |
| Immigrants | Jordan | 99.3 /100 | #79 | Exceptional 11.1% |
| Immigrants | Ireland | 99.3 /100 | #80 | Exceptional 11.1% |
| Immigrants | Poland | 99.1 /100 | #81 | Exceptional 11.1% |
| Chileans | 99.1 /100 | #82 | Exceptional 11.1% |
| Immigrants | Switzerland | 99.0 /100 | #83 | Exceptional 11.1% |
| Immigrants | Sierra Leone | 99.0 /100 | #84 | Exceptional 11.1% |
Demographics Similar to Slovaks by Disability
In terms of disability, the demographic groups most similar to Slovaks are White/Caucasian (13.0%, a difference of 0.0%), African (13.0%, a difference of 0.020%), Cheyenne (13.0%, a difference of 0.060%), Yaqui (13.1%, a difference of 0.28%), and English (13.0%, a difference of 0.44%).
| Demographics | Rating | Rank | Disability |
| Scottish | 0.0 /100 | #282 | Tragic 12.9% |
| Irish | 0.0 /100 | #283 | Tragic 12.9% |
| Welsh | 0.0 /100 | #284 | Tragic 12.9% |
| Crow | 0.0 /100 | #285 | Tragic 12.9% |
| English | 0.0 /100 | #286 | Tragic 13.0% |
| Africans | 0.0 /100 | #287 | Tragic 13.0% |
| Whites/Caucasians | 0.0 /100 | #288 | Tragic 13.0% |
| Slovaks | 0.0 /100 | #289 | Tragic 13.0% |
| Cheyenne | 0.0 /100 | #290 | Tragic 13.0% |
| Yaqui | 0.0 /100 | #291 | Tragic 13.1% |
| Aleuts | 0.0 /100 | #292 | Tragic 13.1% |
| Marshallese | 0.0 /100 | #293 | Tragic 13.1% |
| Celtics | 0.0 /100 | #294 | Tragic 13.1% |
| Immigrants | Nonimmigrants | 0.0 /100 | #295 | Tragic 13.2% |
| Central American Indians | 0.0 /100 | #296 | Tragic 13.2% |